








Inactive Instrument
Company Universal Stainless & Alloy Products, Inc.
Stocks
USAP
US9138371003
Iron & Steel
Business description: Universal Stainless & Alloy Products, Inc.

Number of employees: 678
Sales by Activity: Universal Stainless & Alloy Products, Inc.
| Fiscal Period: December | 2019 (USD) | 2020 (USD) | 2021 (USD) | 2022 (USD) | 2023 (USD) |
|---|---|---|---|---|---|
Metal Processors and Fabrication | 243M | 180M | 156M | 202M | 286M |
Executive Committee: Universal Stainless & Alloy Products, Inc.
| Manager | Title | Age | Since |
|---|---|---|---|
| Chief Executive Officer | 52 | 2023-10-31 | |
Steven DiTommaso
DFI | Director of Finance/CFO | 70 | 2022-03-31 |
Scott Reynolds
CTO | Chief Tech/Sci/R&D Officer | - | 2021-03-31 |
Shawna Locke
SAM | Sales & Marketing | - | - |
John Arminas
LAW | General Counsel | 54 | 2020-03-31 |
Composition of the Board of Directors: Universal Stainless & Alloy Products, Inc.
| Director | Title | Age | Since |
|---|---|---|---|
Frédéric Mattei
BRD | Director/Board Member | 53 | 2025-01-22 |
Timoteo Di Maulo
BRD | Director/Board Member | 67 | 2025-01-22 |
| Director/Board Member | 46 | 2025-01-22 | |
Sudhakar Sivaji
BRD | Director/Board Member | 47 | 2025-01-22 |
| Director/Board Member | 56 | 2025-01-22 |
Company details: Universal Stainless & Alloy Products, Inc.
Universal Stainless & Alloy Products, Inc.
600 Mayer Street
15017, Bridgeville
+(412) 257-7600
http://www.univstainless.com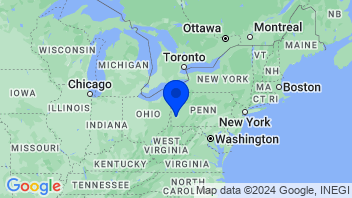
Iron, Steel Mills & Foundries
| Change | 5-day change | 1-year change | 3-year change | Capi.($) | ||
|---|---|---|---|---|---|---|
 | +1.29% | +4.06% | +81.12% | +85.87% | 61.66B | |
| -19.97% | -6.22% | -3.46% | -11.13% | 48.62B | |
| +2.39% | -2.60% | +60.36% | +159.99% | 44.96B | |
| +1.42% | +2.24% | +57.40% | +143.52% | 35.55B | |
| +0.98% | +2.42% | +5.65% | +70.93% | 31.76B | |
| -0.75% | -0.55% | -30.74% | -34.96% | 31.41B | |
| +0.21% | -1.63% | -6.79% | +41.37% | 22.17B | |
| +0.58% | +4.43% | +56.94% | +77.06% | 22.27B | |
| +0.26% | -0.59% | +3.53% | +1.32% | 21.72B | |
| Average | -1.50% | -0.87% | +24.89% | +59.33% | 35.57B | |
| Weighted average by Cap. | -2.19% | -0.95% | +31.23% | +65.18% |


