








Company Matching Maximize Solution Thailand S.E.
Stocks
MATCH-R
TH0703010R17
Entertainment Production
|
End-of-day quote
Thailand S.E.
2026-10-22
|
5-day change | 1st Jan Change | ||
| 0.8000 THB | +5.26% |
|
-2.44% | -2.44% |
Business description: Matching Maximize Solution

Number of employees: 540
Sales by Activity: Matching Maximize Solution
| Fiscal Period: December | 2021 (THB) | 2022 (THB) | 2023 (THB) | 2024 (THB) | 2025 (THB) |
|---|---|---|---|---|---|
Equipment Rental and Service | 249M | 274M | 330M | 358M | 242M |
Studio Rental and Service | 96.4M | 54.36M | 104M | 67.28M | 64.92M |
Content Production | 25.33M | 43.06M | 41.07M | 42.82M | 8.84M |
Sales of Products | 3.14M | 3.59M | 4.23M | 4.51M | 2.41M |
Inter-Segment Revenues | -23.16M | -32.25M | -28.38M | - | -26.31M |
Geographical breakdown of sales: Matching Maximize Solution
| Fiscal Period: December | 2021 (THB) | 2022 (THB) | 2023 (THB) | 2024 (THB) | 2025 (THB) |
|---|---|---|---|---|---|
Thailand | 351M | 343M | 451M | 473M | 292M |
Executive Committee: Matching Maximize Solution
| Manager | Title | Age | Since |
|---|---|---|---|
Chayanont Ulit
CEO | Chief Executive Officer | 56 | 2020-07-31 |
Ladawan Khumsap
DFI | Director of Finance/CFO | 58 | 2002-12-31 |
| Compliance Officer | - | - | |
Nanat Sonsa-ad
IRC | Investor Relations Contact | 43 | - |
| Comptroller/Controller/Auditor | 53 | 2007-10-31 |
Composition of the Board of Directors: Matching Maximize Solution
| Director | Title | Age | Since |
|---|---|---|---|
| Director/Board Member | 62 | 2016-12-31 | |
Kamol Ratanachai
BRD | Director/Board Member | 59 | 2011-04-18 |
| Director/Board Member | 67 | 2014-01-01 | |
| Director/Board Member | 58 | 2020-12-22 | |
| Director/Board Member | - | - | |
Chayanont Ulit
BRD | Director/Board Member | 56 | 2020-07-31 |
Company details: Matching Maximize Solution
Matching Maximize Solution Public Co., Ltd.
Soi Sathu Pradit 19
10300, Bangkok
+
http://www.matchinggroup.com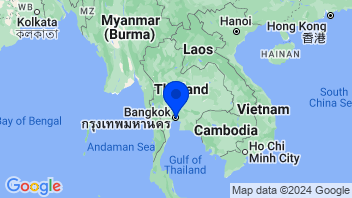
Other Entertainment Production
| Change | 5-day change | 1-year change | 3-year change | Capi.($) | ||
|---|---|---|---|---|---|---|
 | +0.09% | +1.15% | +11.75% | +118.26% | 40.65B | |
| -1.02% | +7.30% | -52.99% | -32.26% | 39.28B | |
| -0.96% | +2.92% | -31.73% | -34.06% | 32.57B | |
| +1.45% | +3.48% | +66.68% | +167.66% | 23.76B | |
| +0.80% | +3.26% | -4.58% | +0.35% | 16.58B | |
| -0.11% | -1.03% | -25.09% | -27.57% | 11.45B | |
| -5.55% | -3.75% | +72.71% | +125.51% | 9.38B | |
| -1.09% | +10.52% | -7.36% | +73.83% | 9.02B | |
| -3.84% | -11.06% | -24.72% | -15.80% | 6.11B | |
| Average | -1.13% | +0.24% | +0.52% | +41.77% | 20.98B | |
| Weighted average by Cap. | -0.56% | +0.21% | -5.04% | +41.58% |


- Stock Market
- Stocks
- MATCH Stock
- MATCH-R Stock
- Company Matching Maximize Solution
Select your edition
All financial news and data tailored to specific country editions


