








|
Market Closed -
OTC Markets
15:39:42 2026-10-09 EDT
|
5-day change | 1st Jan Change | ||
| 1.653 USD | -4.98% |
|
+0.00% | -52.62% |
| 10-22 | Lendlease Group's Outlook Cut to Negative by Fitch Ratings on Slower Capital Recycling | MT |
| 10-21 | Lendlease Global Commercial REIT Achieves Highest-Ever Score in GRESB Rankings; Shares Up 3% | MT |
Business description: Lendlease Group

Number of employees: 12,000
Sales by Activity: Lendlease Group
| Fiscal Period: June | 2022 (AUD) | 2023 (AUD) | 2024 (AUD) | 2025 (AUD) | 2026 (AUD) |
|---|---|---|---|---|---|
Construction | 6.58B | 7.2B | 5.94B | 3B | 3.87B |
Non Core | 433M | 499M | 429M | - | - |
Development | 1.57B | 2.32B | 2.66B | 1.3B | 655M |
Capital Release Unit | - | - | - | 3.17B | 611M |
Corporate | 33M | 17M | 19M | 10M | 12M |
Investments | 346M | 329M | 324M | 268M | 282M |
Geographical breakdown of sales: Lendlease Group
| Fiscal Period: June | 2022 (AUD) | 2023 (AUD) | 2024 (AUD) | 2025 (AUD) | 2026 (AUD) |
|---|---|---|---|---|---|
Australia | 5.16B | 6.1B | 5.52B | 5.52B | 4.91B |
United States | 2.35B | 2.76B | 2.2B | 1.18B | 238M |
Singapore | - | - | - | 113M | 110M |
United Kingdom | - | - | - | 785M | 80M |
Italy | - | - | - | 37M | 63M |
Japan | - | - | - | 54M | 52M |
Malaysia | - | - | - | 83M | 42M |
China | - | - | - | 11M | 5M |
Europe | 1.44B | 1.16B | 1.39B | - | - |
Asia | 374M | 431M | 323M | - | - |
Executive Committee: Lendlease Group
| Manager | Title | Age | Since |
|---|---|---|---|
Nick O'Neil
CEO | Chief Executive Officer | 47 | 2026-07-31 |
Andrew Nieland
CEO | Chief Executive Officer | - | 2026-06-29 |
Penny Ransom
CEO | Chief Executive Officer | 53 | 2026-06-29 |
Michael Vercoe
IRC | Investor Relations Contact | - | 2023-03-31 |
Toby Matthews
PRN | Corporate Officer/Principal | - | 2025-12-31 |
Composition of the Board of Directors: Lendlease Group
| Director | Title | Age | Since |
|---|---|---|---|
Elizabeth Proust
BRD | Director/Board Member | 75 | 2018-01-31 |
Robert Welanetz
BRD | Director/Board Member | - | 2020-02-29 |
| Director/Board Member | - | 2021-11-30 | |
Ann Soo Lui-Chan
BRD | Director/Board Member | 66 | 2022-11-30 |
| Director/Board Member | 61 | 2023-09-30 | |
John Gillam
CHM | Chairman | - | 2024-10-13 |
Lianne Buck
BRD | Director/Board Member | - | 2025-07-06 |
Philippa Kelly
BRD | Director/Board Member | 65 | 2026-08-02 |
Nick O'Neil
BRD | Director/Board Member | 47 | 2026-07-31 |
Holdings: Lendlease Group
| Name | Stocks | % | Valuation |
|---|---|---|---|
| 707,532,365 | 21.27% | 302 M $ |
Company details: Lendlease Group
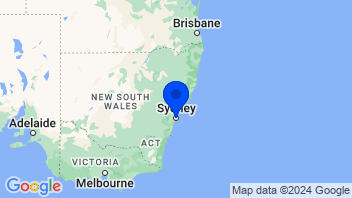
Other Real Estate Development & Operations
| Change | 5-day change | 1-year change | 3-year change | Capi.($) | ||
|---|---|---|---|---|---|---|
 | +1.55% | +10.00% | +120.00% | +989.86% | 68.62B | |
| +1.34% | -1.59% | +12.83% | +29.45% | 38.98B | |
| +2.76% | +5.67% | +15.04% | +98.97% | 29.75B | |
| -2.11% | -2.79% | -20.71% | +77.96% | 26.81B | |
| +0.27% | -5.02% | +0.27% | -0.17% | 26.82B | |
| +2.23% | +5.36% | -5.75% | +44.61% | 27.15B | |
| +0.47% | +5.41% | +11.83% | +188.99% | 20.44B | |
| +0.09% | -0.85% | +16.11% | +12.41% | 19.69B | |
| +2.65% | +2.59% | -2.99% | +79.71% | 19.62B | |
| Average | +1.03% | +2.69% | +16.29% | +169.09% | 30.88B | |
| Weighted average by Cap. | +1.13% | +4.28% | +32.31% | +291.42% |
Sector

Trader
This super rating is the result of a weighted average of the rankings based on the following ratings: Valuation (Composite), EPS Revisions (4 months), and Visibility (Composite). We recommend that you carefully review the associated descriptions.
Investor
This super composite rating is the result of a weighted average of the rankings based on the following ratings: Fundamentals (Composite), Valuation (Composite), EPS Revisions (1 year), and Visibility (Composite). We recommend that you carefully review the associated descriptions.
Global
This composite rating is the result of an average of the rankings based on the following ratings: Fundamentals (Composite), Valuation (Composite), Financial Estimates Revisions (Composite), Consensus (Composite) and Visibility (Composite). The company must be covered by at least 4 of these 5 ratings for the calculation to be carried out. We recommend that you carefully review the associated descriptions.
Quality
This composite rating is the result of an average of rankings based on the following ratings: Returns (Composite), Profitability (Composite) and Quality of Financial Reporting (Composite), and Financial Health (Composite). The company must be covered by at least 2 of these 3 ratings for the calculation to be performed. We recommend that you carefully read the associated descriptions.
ESG MSCI
The MSCI ESG score assesses a company’s environmental, social, and governance practices relative to its industry peers. Companies are rated from CCC (laggard) to AAA (leader). This rating helps investors incorporate sustainability risks and opportunities into their investment decisions.


Annual profits - Rate of surprise


- Stock Market
- Stocks
- LLC Stock
- LLESY Stock
- Company Lendlease Group
Select your edition
All financial news and data tailored to specific country editions


