








Business description: Palo Alto Networks Inc

- managed security services: data center management and storage of data in the cloud, data backup and recovery process management, real-time management and monitoring of IT infrastructure and applications, etc.;
- development of cybersecurity solutions: software solutions for detecting threats and intrusions, protecting against malicious programs, securing data, networks and computer systems (antivirus, anti-spam, web filtering, firewalls, etc.);
- security consulting services: training and updates on threats before, during and after attacks, risk management, etc.
Net sales are distributed geographically as follows: the Americas (67.3%), Europe/Middle East/Africa (20.8%) and Asia/Pacific (11.9%).
Sales by Activity: Palo Alto Networks Inc
| Fiscal Period: July | 2021 (USD) | 2022 (USD) | 2023 (USD) | 2024 (USD) | 2025 (USD) |
|---|---|---|---|---|---|
Security Software & Services | - | 5.5B | 6.89B | 8.03B | 9.22B |
Geographical breakdown of sales: Palo Alto Networks Inc
| Fiscal Period: July | 2021 (USD) | 2022 (USD) | 2023 (USD) | 2024 (USD) | 2025 (USD) |
|---|---|---|---|---|---|
United States | 2.75B | 3.56B | 4.42B | 5.13B | 5.79B |
Europe, The Middle East, and Africa (EMEA) | 817M | 1.06B | 1.36B | 1.6B | 1.92B |
Asia Pacific and Japan (APAC) | 501M | 643M | 813M | 943M | 1.1B |
Other Americas | 190M | 242M | 296M | 349M | 419M |
Executive Committee: Palo Alto Networks Inc
| Manager | Title | Age | Since |
|---|---|---|---|
Nikesh Arora
CEO | Chief Executive Officer | 58 | 2018-05-31 |
BJ Jenkins
PSD | President | 60 | 2021-08-09 |
Dipak Golechha
DFI | Director of Finance/CFO | 52 | 2021-03-16 |
Meerah Rajavel
CTO | Chief Tech/Sci/R&D Officer | 54 | 2022-03-31 |
Lee Klarich
CTO | Chief Tech/Sci/R&D Officer | 51 | 2025-08-13 |
Composition of the Board of Directors: Palo Alto Networks Inc
| Director | Title | Age | Since |
|---|---|---|---|
James Goetz
BRD | Director/Board Member | 60 | 2005-03-31 |
Lee Klarich
BRD | Director/Board Member | 51 | 2025-08-13 |
John Donovan
BRD | Director/Board Member | 65 | 2012-09-17 |
Carl Eschenbach
BRD | Director/Board Member | 59 | 2013-05-22 |
Nikesh Arora
CHM | Chairman | 58 | 2018-05-31 |
Lorraine Twohill
BRD | Director/Board Member | 55 | 2019-04-08 |
John Key
BRD | Director/Board Member | 65 | 2019-04-08 |
Aparna Bawa
BRD | Director/Board Member | 48 | 2021-05-12 |
| Director/Board Member | 59 | 2025-02-11 | |
Mark Goodburn
BRD | Director/Board Member | 63 | 2025-11-17 |
Company details: Palo Alto Networks Inc
Palo Alto Networks, Inc.
3000 Tannery Way
95054, Santa Clara
+408 753 4000
http://www.paloaltonetworks.com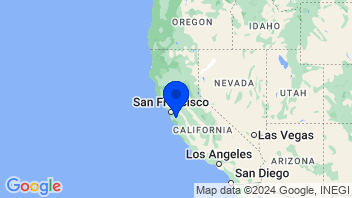
Group companies: Palo Alto Networks Inc
| Name | Category and Sector |
|---|---|
Cyberark Software (India) Pvt Ltd. | |
Palo Alto Networks (India) Pvt Ltd.
 Palo Alto Networks (India) Pvt Ltd. Miscellaneous Commercial ServicesCommercial Services Engages in legal, accounting, book keeping, auditing, tax consulting, public opinion polling, business and management consulting services |
Miscellaneous Commercial Services
|
Palo Alto Networks (India) Technologies Pvt Ltd. | |
Packaged Software
| |
Palo Alto Networks (Netherlands) BV
 Palo Alto Networks (Netherlands) BV Information Technology ServicesTechnology Services Provides network security services |
Information Technology Services
|
Security Software
| Change | 5-day change | 1-year change | 3-year change | Capi.($) | ||
|---|---|---|---|---|---|---|
 | -0.08% | -9.75% | +58.67% | +389.60% | 187B | |
| +0.55% | -5.72% | +45.43% | +97.19% | 111B | |
| +3.07% | -3.37% | -15.33% | +33.82% | 15.1B | |
| +0.84% | -7.26% | -14.55% | - | 14.95B | |
| +3.62% | -4.76% | -41.19% | +2.58% | 12.87B | |
| +4.44% | -4.66% | -26.97% | - | 8.12B | |
| -9.68% | -6.91% | -3.28% | -7.28% | 6.99B | |
| +2.14% | -3.79% | -14.31% | +73.59% | 5.14B | |
| -0.91% | -4.44% | +122.96% | +93.26% | 5.05B | |
| Average | +0.44% | -8.89% | +12.38% | +97.54% | 40.67B | |
| Weighted average by Cap. | +0.35% | -8.35% | +41.88% | +247.55% |

Trader
This super rating is the result of a weighted average of the rankings based on the following ratings: Valuation (Composite), EPS Revisions (4 months), and Visibility (Composite). We recommend that you carefully review the associated descriptions.
Investor
This super composite rating is the result of a weighted average of the rankings based on the following ratings: Fundamentals (Composite), Valuation (Composite), EPS Revisions (1 year), and Visibility (Composite). We recommend that you carefully review the associated descriptions.
Global
This composite rating is the result of an average of the rankings based on the following ratings: Fundamentals (Composite), Valuation (Composite), Financial Estimates Revisions (Composite), Consensus (Composite) and Visibility (Composite). The company must be covered by at least 4 of these 5 ratings for the calculation to be carried out. We recommend that you carefully review the associated descriptions.
Quality
This composite rating is the result of an average of rankings based on the following ratings: Returns (Composite), Profitability (Composite) and Quality of Financial Reporting (Composite), and Financial Health (Composite). The company must be covered by at least 2 of these 3 ratings for the calculation to be performed. We recommend that you carefully read the associated descriptions.
ESG MSCI
The MSCI ESG score assesses a company’s environmental, social, and governance practices relative to its industry peers. Companies are rated from CCC (laggard) to AAA (leader). This rating helps investors incorporate sustainability risks and opportunities into their investment decisions.


