May same-store sales increased 4.7% year-over-year
As of
May Retail Same-Store Sales Highlights
(Same-store sales, unit sales, transactions, and average price data throughout this release refer to
- Same-store sales increased 4.7% from a year earlier (
May 2023 ). In the previous month (April 2024 ), average sales had increased 2.5% compared toApril 2023 . - Same-store sales increased 3.4% compared to the previous month (
April 2024 ). Same-store sales inApril 2024 had decreased 0.9% compared to the previous month (March 2024). - For the three months ended
May 31, 2024 , same-store sales increased 4.3% compared to the three months endedMay 31, 2023 . - The number of items sold increased 4.7% from a year earlier (
May 2023 ). In the previous month (April 2024 ), the number of items sold had increased 3.7% compared toApril 2023 . - The average number of transactions per store increased 2.3% from a year earlier (
May 2023 ). In the previous month (April 2024 ), the average number of transactions had increased 1.7% compared toApril 2023 . - A dollar-weighted average of prices for the top 500 items purchased increased 1.6% year-over-year, an increase from the 0.2% year-over-year increase recorded in
April 2024 and the highest rate of price increases reported sinceNovember 2023 .
Commentary from
“In May, the NRS point-of-sale network generated solid same-store sales growth versus the year ago and prior month across dollars, baskets, and units scanned.
“Looking at popular categories, Smokeless Tobacco sales continued their upward trajectory propelled by the surging popularity of nicotine pouches, while Tobacco and Cigarette sales declined modestly from year ago levels. Within the Tobacco Alternatives category, Vape scans stood out with continued year-over-year decreases in baskets, units and dollar sales.
“Within Beverages, mid-May marks the start of ‘cold beverage season.’ This May we did indeed see the expected, sequential lift across most cold beverage categories. Beer, NA Beer, FMB/Cider/Seltzer, Soft Drinks, Water (still, value-add, and sparkling), and Coconut Water all grew dollar sales sequentially and year over year. Bucking the trend, Energy Drinks and Sports Drinks saw little seasonal benefit and trailed year-ago sales levels.
“Sales of high-protein offerings, including Performance Nutritional Shakes and Bars, as well as Protein Salty Snacks have increased significantly in recent months. Their market strength closely correlates with broader retail patterns influenced by the increasing popularity of GLP-1 agonist weight loss drugs, which are often paired with high-protein diets for optimal outcomes. Across the retail landscape, health trends, consumer preferences, and product innovation remain key inter-connected drivers of category and brand performance.”
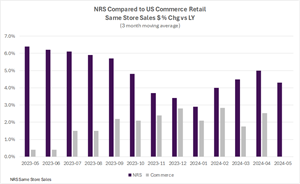
Retail Trade Comparative Data
The table below provides historical comparative data with the

Over the past twelve months, the NRS network’s three-month moving average same-store sales have outpaced the US Commerce Department’s Advance Monthly Retail Trade data excluding food services by 3.0% percentage points, on average.
The NRSInsights data in the chart above have not been adjusted to reflect inflation, demographic distributions, seasonal buying patterns, item substitution, days per month, or other factors that may facilitate comparisons to other periods, to other same-store retail sales data, or to the
NRSInsights Reports
The NRSInsights monthly Same-Store Retail Sales Reports are intended to provide timely topline data reflective of sales at NRS’ network of independent, predominantly urban, retail stores.
Same-store data comparisons of
Same-store data comparisons for the three months ended
NRS POS Network
The NRS network comprises approximately 30,800 active POS terminals operating in approximately 26,800 independent retail stores. Its platform predominantly serves small-format, independent, retail stores including convenience stores, bodegas, liquor stores, grocers, tobacco and sundries sellers. The network includes retailers in all 50 states and in 198 of the 210 designated market areas (DMAs) in
About National Retail Solutions (NRS):
National Retail Solutions operates the largest point-of-sale (POS) terminal-based platform and digital payment processing service for independent retailers nationwide. Retailers utilize NRS offerings to process transactions and effectively manage their businesses. Consumer packaged goods (CPG) suppliers, brokers, analytics firms, and advertisers access the terminal’s digital display network to reach these retailers’ predominantly urban, multi-cultural shopper base, and to harness transaction data-based learnings to identify growth opportunities and measure execution and returns on marketing investment. NRS is a subsidiary of
All statements above that are not purely about historical facts, including, but not limited to, those in which we use the words “believe,” “anticipate,” “expect,” “plan,” “intend,” “estimate,” “target” and similar expressions, are forward-looking statements within the meaning of the Private Securities Litigation Reform Act of 1995. While these forward-looking statements represent our current judgment of what may happen in the future, actual results may differ materially from the results expressed or implied by these statements due to numerous important factors. Our filings with the
NRSInsights Contact:
SVP, Data Strategy and Sales at NRS
National Retail Solutions
suzy.silliman@nrsplus.com
IDT Corporation Contact:
william.ulrey@idt.net
# # #
Attachment
- National Retail Solutions

![]()
National Retail Solutions
US Commerce Department’s Advance Monthly Retail Trade data
2024 GlobeNewswire, Inc., source


