To receive Tyler’s analysis directly via email, please SIGN UP HERE
Talking Points:
- Crude Oil Technical Strategy: Short Bias Remains As Falling Resistance Holds On Strengthening USD
- Supply and Demand Imbalance Fix At Algiers Could Trigger LT Bullish Head & Shoulders Pattern
- Contrarian Sentiment System Now Favors Further Downside Risk
The prospects for higher Oil prices appear to be hanging by an increasingly thinner thread. A host of developments would need to arise for the Bull Market that began in Q1 to carry the price back toward ~$60/bbl.
First, the US Dollar, which is inversely correlated to the price of Oil would need to move lower in a rather aggressive fashion. While such a move is possible, it would likely require the Federal Reserve to underwhelm the market over the coming meetings in 2016. Currently, a stronger Dollar seems to be the path of least resistance as the markets are pricing in one rate-hike in 2016. Such Dollar implied strength is also seen in the 3M LIBOR rate recently hitting 7-year highs.
Should the first domino of a weaker US Dollar develop, we would also need to see the surge in supply reverse or become overtaken by the growth in demand. Naturally, growth in demand for Oil is what many want to see as it would indicator that the forces of economic production are up and running again. However, this has not been the case, and it would seem now that many positive developments would need to arise for this to be the case.
Track short-term Crude Oil price levels and patterns with the GSI indicator!
Lastly, a move higher appears unlikely if OPEC is unable to reach an agreement to cap production in Algiers next week. The market has been awarding OPEC for rumors of an accord to cap production at current levels, but as we’ve seen in the past if they’re unable to solidify an agreement, further selling pressure likely will arise. To see where the selling pressure may take us, let’s look at the charts.
TradingView D1 Crude Oil Price Chart: Head & Shoulder’s Bullish Pattern Still Validating
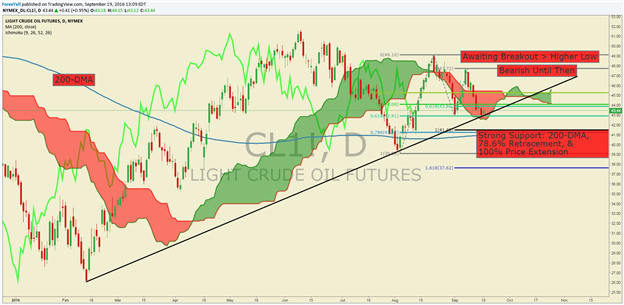
The chart above shows competing technical stories. As explained earlier, the fundamental pressure appears to be for a push lower, but a reversal of main themes and a price breakout should be on the mind of traders as it could signal a fresh opportunity.
Currently, the price of Crude Oil is sitting on the support of a trendline drawn from the February & August low. In addition to the trend line, we see the price is sitting at the base of the Ichimoku Cloud and is at the 61.8% price retracement ( $42.91/bbl) of the August-September price range. If the price can hold the support mentioned above, and move above the higher low, which is the September opening range high at $47.71, we could be on the cusp of a renewed Bull Market. A failure for the price to break above $47.15 would keep us patiently on the bearish side of the Oil market with a keen focus on fundamental stories.
Access Our Free Q3 Oil Outlook As Oil's Best Quarter Looks For Confirmation
In the last note, we shared about the potential for the head and shoulders breakout, which is a classic bullish price pattern that fails to play out as often as newer traders would hope. The bullish pattern could align with a continuation of the move higher that developed after the extreme low in February. Since February 11, the Oil market has recovered aggressively and is now sitting close to long-term price channel resistance and sitting above the 200-DMA at $40.99/bbl. The 200-DMA also sits very close to the 100% Fibonacci Extention on the move lower, which is at $41.39/bbl. Many eyes are on these levels from an institutional side to see if buyer’s begin to pour into Crude long positions with stops likely at the August low of $39.17/bbl.
Given the recent US Dollar strength, which is emerging against commodity FX like the Canadian Dollar and Emerging Market currencies like the Mexican Peso, we could continue to see a move toward the 200-DMA ($40.99/bbl). A supportive component of US Dollar strength appears to be USD Funding costs on the international interbank stage that are shown with 3M USD LIBOR currently at 7-year highs.
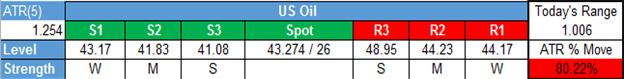
Short-term support remains at the September opening range low at $43.02/bbl. A break below there would turn the focus to the 200-DMA. Short-term resistance favors the September opening range high at $47.71/bbl. From a Global Macro perspective, we may continue to see more stories favoring price moving towards support.
Key Levels Over the Next 48-hrs of Trading As of Monday, September 19, 2016
T.Y.
original source


