Same-store sales at NRS retailers during October increased 3.2% compared to
Compared to
As of
Retail Same-Store Sales Highlights
- Same-store sales in
October 2023 increased 3.2% from a year earlier (October 2022 ). Average sales per calendar day forOctober 2023 decreased 2.1% compared to the preceding month (September 2023). - Same-store sales in the preceding month (
September 2023 ) had increased 6.1% compared to the year-ago month (September 2022 ). Average sales per calendar day inSeptember 2023 had increased 1.7% compared to the preceding month (August 2023). - For the three months ended
October 31, 2023 , same-store sales increased 4.8% compared to the three months endedOctober 31, 2022 . - The number of items sold during
October 2023 increased 4.1% compared toOctober 2022 but decreased 0.9% compared toSeptember 2023 on a per calendar day basis. - The average number of transactions per store in
October 2023 increased 2.8% compared toOctober 2022 . The average number of transactions per calendar day inOctober 2023 decreased 1.6% compared toSeptember 2023 . - A dollar-weighted average of prices for the top 500 items purchased in
October 2023 increased 1.6% year-over-year, a decrease from the 5.3% year-over-year increase recorded inSeptember 2023 .
Commentary from
“October’s same-store sales at retailers utilizing our POS platform increased 3.2% year over year, but decreased 2.1% on a per-day basis compared to September. Inflationary pressures, which were exceptionally strong in September when prices increased 5.3% year over year, moderated to 1.6% in
“Shopping patterns during October have evolved over the years. This year, the great “bump” in sales of popular
“Halloween is always an interesting holiday to watch with its skew to sales of chocolate and confections. Earlier this year, increasing unit prices pressured sales in these categories. In October, unit sales of chocolate and confections came in below the year-ago levels as shoppers at stores in the NRS network turned to other sugary snacks to satisfy their sweet tooth.
“Our retailers’ three-month rolling year-over-year same-store sales increase of 4.8% has been, on average, 4.8% above the
Retail Trade Comparative Data
The table below provides historical comparative data with the
Over the past eleven months, the NRS network’s three-month moving average same-store sales have outpaced the US Commerce Department’s Advance Monthly Retail Trade data excluding food services by 4.8 percentage points, on average.
The NRSInsights data have not been adjusted to reflect inflation, demographic distributions, seasonal buying patterns, item substitution, or other factors that may facilitate comparisons to other periods, to other same-store retail sales data, or to the
NRSInsights Reports
The NRSInsights monthly Same-Store Retail Sales Reports are intended to provide timely topline data reflective of sales at NRS’ network of independent, predominantly urban, retail stores.
Same-store data comparisons of
Same-store data comparisons for the three months ended
NRS POS Network
The NRS network comprises approximately 27,200 active POS terminals operating in approximately 23,700 independent retail stores. Its platform predominantly serves small-format, independent, retail stores including convenience stores, bodegas, liquor stores, grocers, and tobacco and sundries sellers. The network includes retailers in all 50 states and in 196 of the 210 designated market areas (DMAs) in the
About National Retail Solutions (NRS):
National Retail Solutions operates the largest point-of-sale (POS) terminal-based platform and digital payment processing service for independent retailers nationwide. Retailers utilize NRS offerings to process transactions and effectively manage their businesses. Consumer packaged goods (CPG) suppliers, brokers, analytics firms and advertisers access the terminal’s digital display network to reach these retailers’ predominantly urban, multi-cultural shopper base, and to harness transaction data-based learnings to identify growth opportunities and measure execution and returns on marketing investment. NRS is a subsidiary of
All statements above that are not purely about historical facts, including, but not limited to, those in which we use the words “believe,” “anticipate,” “expect,” “plan,” “intend,” “estimate,” “target” and similar expressions, are forward-looking statements within the meaning of the Private Securities Litigation Reform Act of 1995. While these forward-looking statements represent our current judgment of what may happen in the future, actual results may differ materially from the results expressed or implied by these statements due to numerous important factors. Our filings with the
NRSInsights Contact:
SVP, Data Strategy and Sales at NRS
National Retail Solutions
suzy.silliman@nrsplus.com
IDT Corporation Contact:
william.ulrey@idt.net
# # #
Attachment
- Retail Trade Comparative Data

![]()
Retail Trade Comparative Data
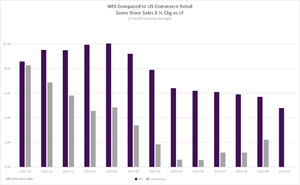
Historical comparative data with the U.S. Commerce Department’s Advance Monthly Retail Trade same-store sales data excluding food service
2023 GlobeNewswire, Inc., source
