Heartland Express : Reports All-Time Records for Total Assets and Stockholders' Equity in 2019 and Provides Historical Financial Review
January 23, 2020 at 09:01 am
Share
NORTH LIBERTY, Iowa, Jan. 23, 2020 (GLOBE NEWSWIRE) -- Heartland Express, Inc. (Nasdaq: HTLD) announced today financial results for the quarter and year ended December 31, 2019.
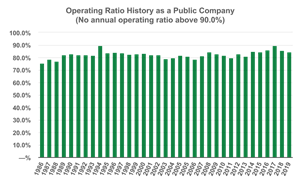
Operating Ratio History as a Public Company (No annual operating ratio above 90.0%)
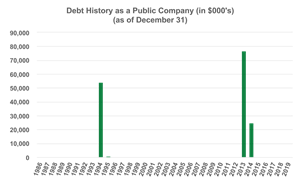
Debt History as a Public Company (in $000's) (as of December 31)
Heartland Express Chief Executive Officer Michael Gerdin, commented on the operating results and ongoing initiatives of the Company, "As we embark on a new decade, we look back at operating through the past forty plus years as an organization. These years have been filled with the volatile ups and downs in our industry. The past two years are a great example and reminder of these dynamic conditions. The year of 2018 provided strong demand for freight and elevated freight rates that allowed our industry to increase driver wages and many companies to thrive. In contrast, 2019 provided freight demand which was significantly weaker than the prior year where pricing pressures were the norm and many of our peers were forced to lower freight rates, make short-term reactionary decisions, and some even closed their doors for good. We do not operate based on the short-term mindset. Our operating model is built on the long-term foundations that have stayed true for us in good operating environments and bad, and have allowed us to deliver efficient and consistent operating results. I would like to reflect on the past four decades where we have remained committed to a long-term strategy and disciplined financial approach that have returned value to our stockholders, provided stability and well-deserved wages for our drivers and employees, and allowed us to deliver premium on-time service to our loyal customers over the long haul.
During 2019, we completed our eighth acquisition which was also our third in the last six years when we acquired Millis Transfer in August 2019. Previous acquisitions include, H&B Carriers (1987), PDQ Transportation (1989), Munson Transportation (1994), A&M Express (1997), Great Coastal Express (2002), Gordon Trucking (2013), Interstate Distributor (2017), and Millis Transfer (2019), each of which was operating at an operating ratio in the 90's or above when acquired. These eight acquisitions and organic growth have allowed us to become a nationwide truckload carrier with twenty-nine terminal locations and an infrastructure network which is leveraged to provide time-sensitive service to our customers, options for our drivers to operate regionally and closer to home, and the ability to maintain and service our equipment regularly. We pride ourselves on operating a young fleet of tractors and trailers - the average age of our tractors over the last twenty years is 1.7 years for tractors and 3.9 years for trailers as compared to 1.8 years for tractors and 3.6 years for trailers as of December 31, 2019.
Our operating results reflect our disciplined approach focused on the long term as noted below:
Years
Operating revenue (in thousands)
Fuel surcharge revenue(1) (non-GAAP) (in thousands)
Operating expenses (in thousands)
Net income (in thousands)
Operating ratio
Adjusted operating ratio(1) (non-GAAP)
2010 to 2019
$6,191,731
$960,187
$5,204,969
$698,999
84.1%
81.1%
2000 to 2009
4,545,137
480,148
3,690,674
596,600
81.2%
79.0%
1990 to 1999
1,781,045
530
1,492,281
194,662
83.8%
83.8%
1980 to 1989
206,691
—
163,869
25,400
79.3%
79.3%
Total
$12,724,604
$1,440,865
$10,551,793
$1,515,661
82.9%
80.7%
Compound annual growth rate (CAGR)
11.8%
12.3%
Our revenues have grown at a compound annual growth rate of 11.8% and our net income has grown at a compound annual growth rate of 12.3% over the course of the past four decades. In addition, we have never had annual results with an operating ratio (operating expenses divided by operating revenue) in the 90's.
Operating Ratio History as a Public Company (No annual operating ratio above 90.0%): https://www.globenewswire.com/NewsRoom/AttachmentNg/a5265ba8-67ea-4d19-a605-a1d1c04e4ee2
We have consistently leveraged cash from operations to fund our significant capital expenditures for revenue equipment, terminal locations, and other infrastructure. Further, we have assumed debt of an acquired company or borrowed funds related to an acquisition, which resulted in debt presented on our annual balance sheets only four times within the last forty years. Our operating model has yielded the following growth in both assets and stockholders' equity:
Quarter end
Highest total assets (in thousands, except percentages)
Highest total stockholders' equity (in thousands, except percentages)
During 2019
$949,043 (2)
All-time High
$684,659 (3)
All-time High
During 2009
568,626 (2)
367,670 (3)
During 1999
282,399 (2)
211,526 (2)
Compound annual growth rate (CAGR)
6.2%
6.5%
20-year average return on assets
11.6%
20-year average return on stockholders' equity
17.1%
(2) Balance as of September 30. (3) Balance as of December 31.
Debt History as a Public Company (in $000's) (as of December 31): https://www.globenewswire.com/NewsRoom/AttachmentNg/38488de4-fc7e-4fa5-a210-e6caf67c9ccd
We have also returned value to our stockholders in the form of dividends and repurchases of our common stock as presented below. Further, there have been nine stock splits since 1991 and three special dividends since 2007.
Year
Dividends paid (in thousands)
Shares of common stock repurchased (in thousands)
Repurchases of common stock (in thousands)
2010 to 2019
$244,344
12,067
$194,330
2000 to 2009
239,546
10,012
140,126
1990 to 1999
—
3,540
45,132
Total
$483,890
25,619
$379,588
Turning to our fourth quarter and full year results for 2019, our operating results showed strength in operating revenues following the acquisition of Millis Transfer. We delivered sequential revenue growth over the four consecutive quarters of 2019 - $139.5 million in Q1, $142.1 million in Q2, $147.9 million in Q3, and $167.2 million in Q4, respectively. We reported $76.7 million of cash on hand following payments of $61.9 million to complete the Millis acquisition and $93.3 million to retire the acquired revenue equipment debt in full from the acquisition. We are once again 100% debt free.
We are pleased with our current results for 2019 which were delivered in a more challenging operating environment as compared to 2018. We are extremely proud of our long and consistent history of strong financial results, which are made possible by our dedicated drivers, the team that supports them, and partnership from our loyal customers. We look forward to the new decade ahead and believe we are extremely well-positioned for the future as an organization."
Three months ended December 31, 2019:
Net Income of $12.8 million, Earnings per Share of $0.16 and Operating Revenue of $167.2 million.
Operating Income of $17.7 million.
Operating Ratio of 89.4% and 87.9% Non-GAAP Adjusted Operating Ratio(1).
Debt-free balance sheet.
Cash balance of $76.7 million.
Fleet average age of tractors - 1.8 years.
Fleet average age of trailers - 3.6 years.
Twelve months ended December 31, 2019:
Net Income of $73.0 million, Earnings per Share of $0.89 and Operating Revenue of $596.8 million.
Operating Income of $94.3 million.
Operating Ratio of 84.2% and 81.9% Non-GAAP Adjusted Operating Ratio(1).
Our forty-second consecutive year with an operating ratio in the 80's or below.
Total Stockholders' Equity of $684.7 million, an All-time High.
Total Assets of $898.9 million.
Organic and acquired driver growth in 2019.
Financial Results
Heartland Express ended the fourth quarter of 2019 with operating revenues of $167.2 million, compared to $147.0 million in the fourth quarter of 2018. Operating revenues for the quarter included fuel surcharge revenues of $21.5 million compared to $19.9 million in the same period of 2018, a $1.6 million increase. Net income was $12.8 million, compared to $22.4 million in the fourth quarter of 2018. Basic earnings per share were $0.16 during the quarter compared to $0.27 earnings per share in the fourth quarter of 2018. The Company posted an operating ratio of 89.4%, non-GAAP adjusted operating ratio(1) of 87.9%, and a 7.6% net margin (net income as a percentage of operating revenues) in the fourth quarter of 2019 compared to 79.9%, 76.7% and 15.3%, respectively in the fourth quarter of 2018. During the fourth quarter, operating revenues were improved while net income, basic earnings per share, and operating ratio results were negatively impacted by the inclusion of the financial results of Millis transfer following the acquisition and market dynamics.
For the twelve month period ended December 31, 2019, operating revenues were $596.8 million, compared to $610.8 million in the same period of 2018. Operating revenues included fuel surcharge revenues of $75.0 million compared to $85.3 million in the same period of 2018, a $10.3 million decrease. Net income was $73.0 million, compared to $72.7 million in the same period of 2018. Basic earnings per share were $0.89 compared to $0.88 earnings per share in the same period of 2018. Operating income for the twelve-month period increased $4.5 million. The Company posted an operating ratio of 84.2%, non-GAAP adjusted operating ratio(1) of 81.9% and a 12.2% net margin (net income as a percentage of operating revenues) in the twelve months ended December 31, 2019 compared to 85.3%, 82.9% and 11.9%, respectively in 2018. The operating results for the twelve months ended December 31, 2019 included the financial results of Millis Transfer for the period August 26, 2019 to December 31, 2019.
Balance Sheet, Liquidity, and Capital Expenditures
At December 31, 2019, the Company had $76.7 million in cash balances and no borrowings under the Company's unsecured line of credit. As a result of the Millis Transfer acquisition, $93.3 million in revenue equipment related debt was retired between the acquisition date and December 31, 2019. Following the first amendment to our existing line of credit on August 31, 2018, the Company's borrowing base was $100 million. The Company had $88.7 million in available borrowing capacity on the line of credit at December 31, 2019 after consideration of $11.3 million in outstanding letters of credit. In addition to the current borrowing base of $100 million, the Company has the ability to increase the available borrowing base by $100 million, subject to normal credit and lender approvals. The Company continues to be in compliance with associated financial covenants. The Company ended the quarter with total assets of $898.9 million and stockholders' equity of $684.7 million, an all-time record.
Net cash flows from operations for the twelve month period ended December 31, 2019 were $146.4 million, 24.5% of operating revenues. The primary use of cash during the twelve month period ended December 31, 2019 was $70.8 million for net property and equipment transactions, $61.9 million for the acquisition of Millis Transfer, $93.3 million repayments of acquired revenue equipment debt, and $6.6 million for dividends. The average age of the Company's tractor fleet was 1.8 years as of December 31, 2019 compared to 1.3 years at December 31, 2018. The average age of the Company's trailer fleet was 3.6 years at December 31, 2019 compared to 3.5 years at December 31, 2018. We continued to refresh our fleet of revenue equipment and also focused on significant renovations and upgrades across our terminal locations to provide updated facilities and comforts for our drivers away from home. The Company currently estimates approximately $120 to $140 million in net capital expenditures for revenue equipment and our terminal network infrastructure and related improvements during 2020. The Company ended the past twelve months with a return on total assets of 8.2% and a 11.0% return on equity.
The Company continued its commitment to stockholders through the payment of cash dividends. Dividends of $0.02 per share were declared and paid during each quarter of 2019. The Company has now paid cumulative cash dividends of $483.9 million, including three special dividends, ($2.00 in 2007, $1.00 in 2010, and $1.00 in 2012) over the past sixty-six consecutive quarters. During 2019 no shares were repurchased as compared to 2018 where we repurchased 1.4 million shares for $25.1 million. The Company has repurchased 6.1 million shares of common stock for approximately $113.8 million over the past five years. The Company has the ability to repurchase an additional 6.9 million shares under the current authorization which would result in 75.2 million outstanding shares if fully executed.
Other Information
Historical commitment to customer service has allowed us to build solid, long-term relationships and brand ourselves as an industry leader for on-time service. This past year we once again were recognized for customer service by several of our customers. These awards received include:
FedEx Express Core Carrier of the Year
FedEx Express Platinum Award (99.93% On-Time Delivery)
Lowe's - One-Way Store Carrier of the Year
Quaker/Gatorade - 2018 Carrier of the Year (Central West Region)
Quaker/Gatorade - 2018 Carrier of the Year (Southwest Region)
During 2019, we were also recognized with the following safety, operational, diversity, community service, and environmental awards:
BP Driving Safety Standards Award 2018
Logistics Management Quest for Quality Award (our sixteenth award in seventeen years)
Commercial Carrier Journal Top 250 Award (#49)
2020 Women on Boards "W" Winning Company
Women Inc. Magazine's 2019 Most Influential Corporate Board Directors - Tahira K. Hira and Brenda Neville
Wreaths Across America Honor Fleet
US EPA SmartWay Excellence Award
These awards are hard-earned and are a direct reflection upon our outstanding group of employees and our focus on excellence in all areas of our business.
Operating revenue excluding fuel surcharge revenue, fuel surcharge revenue, and adjusted operating ratio are non-GAAP financial measures and are not intended to replace financial measures calculated in accordance with GAAP. These non-GAAP financial measures supplement our GAAP results. We believe that using these measures affords a more consistent basis for comparing our results of operations from period to period. The information required by Item 10(e) of Regulation S-K under the Securities Act of 1933 and the Securities Exchange Act of 1934 and Regulation G under the Securities Exchange Act of 1934, including a reconciliation to the most directly comparable financial measure calculated in accordance with GAAP, is included in the table at the end of this press release.
This press release may contain statements that might be considered as forward-looking statements within the meaning of the Private Securities Litigation Reform Act of 1995, as amended. Such statements may be identified by their use of terms or phrases such as “seek,” “expects,” “estimates,” “anticipates,” “projects,” “believes,” “hopes,” “plans,” “goals,” “intends,” “may,” “might,” “likely,” “will,” “should,” “would,” “could,” “potential,” “predict,” “continue,” “strategy,” “future,” “outlook,” and similar terms and phrases. In this press release, the statements relating to reducing unnecessary or unproductive costs, operational improvements, progress toward our goals, and future capital expenditures are forward-looking statements. Such statements are based on management's belief or interpretation of information currently available. These statements and assumptions involve certain risks and uncertainties, and undue reliance should not be placed on such statements. Actual events may differ materially from those set forth in, contemplated by, or underlying such statements as a result of numerous factors, including, without limitation, those specified in the Company's Annual Report on Form 10-K for the year ended December 31, 2018. The Company assumes no obligation to update any forward-looking statements, which speak as of their respective dates.
Contact: Heartland Express, Inc. Mike Gerdin, Chief Executive Officer Chris Strain, Chief Financial Officer 319-626-3600
HEARTLAND EXPRESS, INC. AND SUBSIDIARIES CONSOLIDATED STATEMENTS OF INCOME (In thousands, except per share amounts) (unaudited)
Three Months Ended December 31,
Twelve Months Ended December 31,
2019
2018
2019
2018
OPERATING REVENUE
$
167,226
$
147,003
$
596,815
$
610,803
OPERATING EXPENSES:
Salaries, wages, and benefits
$
72,002
$
53,178
$
240,139
$
227,872
Rent and purchased transportation
1,768
3,049
7,984
18,700
Fuel
30,141
25,196
101,871
110,536
Operations and maintenance
6,749
6,173
24,479
27,143
Operating taxes and licenses
3,651
4,351
14,459
16,390
Insurance and claims
4,973
4,365
17,003
17,227
Communications and utilities
1,415
1,234
4,953
6,086
Depreciation and amortization
29,798
25,028
100,212
100,519
Other operating expenses
6,429
4,423
22,781
21,506
Gain on disposal of property and equipment
(7,362
)
(9,553
)
(31,341
)
(24,963
)
149,564
117,444
502,540
521,016
Operating income
17,662
29,559
94,275
89,787
Interest income
454
779
3,955
2,130
Interest expense
(600
)
—
(1,052
)
—
Income before income taxes
17,516
30,338
97,178
91,917
Federal and state income taxes
4,727
7,898
24,211
19,240
Net income
$
12,789
$
22,440
$
72,967
$
72,677
Earnings per share
Basic
$
0.16
$
0.27
$
0.89
$
0.88
Diluted
$
0.16
$
0.27
$
0.89
$
0.88
Weighted average shares outstanding
Basic
82,025
81,927
81,980
82,378
Diluted
82,074
81,954
82,024
82,410
Dividends declared per share
$
0.02
$
0.02
$
0.08
$
0.08
HEARTLAND EXPRESS, INC. AND SUBSIDIARIES CONDENSED CONSOLIDATED BALANCE SHEETS (in thousands, except per share amounts) (unaudited)
December 31,
December 31,
ASSETS
2019
2018
CURRENT ASSETS
Cash and cash equivalents
$
76,684
$
161,448
Trade receivables, net
56,753
48,955
Prepaid tires
9,107
9,378
Other current assets
8,947
12,551
Income tax receivable
323
170
Total current assets
151,814
232,502
PROPERTY AND EQUIPMENT
739,143
603,670
Less accumulated depreciation
212,856
200,550
526,287
403,120
GOODWILL
168,295
132,410
OTHER INTANGIBLES, NET
27,136
14,494
DEFERRED INCOME TAXES, NET
6,006
4,535
OTHER ASSETS
19,393
19,152
$
898,931
$
806,213
LIABILITIES AND STOCKHOLDERS' EQUITY
CURRENT LIABILITIES
Accounts payable and accrued liabilities
$
11,060
$
10,552
Compensation and benefits
24,712
22,558
Insurance accruals
17,584
22,130
Other accruals
10,051
9,449
Total current liabilities
63,407
64,689
LONG-TERM LIABILITIES
Income taxes payable
5,956
5,577
Deferred income taxes, net
93,698
71,041
Insurance accruals less current portion
51,211
48,934
Total long-term liabilities
150,865
125,552
COMMITMENTS AND CONTINGENCIES
STOCKHOLDERS' EQUITY
Capital stock, common, $.01 par value; authorized 395,000 shares; issued 90,689 in 2019 and 2018; outstanding 82,028 and 81,930 in 2019 and 2018, respectively
$
907
$
907
Additional paid-in capital
4,141
3,454
Retained earnings
826,666
760,262
Treasury stock, at cost; 8,661 and 8,759 shares in 2019 and 2018, respectively
(a) Operating revenue excluding fuel surcharge revenue, fuel surcharge revenue, and adjusted operating ratio as reported in this press release are based upon operating expenses, net of fuel surcharge revenue, as a percentage of operating revenue excluding fuel surcharge revenue. We believe that adjusted operating ratio is more representative of our underlying operations by excluding the volatility of fuel prices, which we cannot control. Adjusted operating ratio is not a substitute for operating ratio measured in accordance with GAAP. There are limitations to using non-GAAP financial measures. Although we believe that adjusted operating ratio improves comparability in analyzing our period-to-period performance, it could limit comparability to other companies in our industry if those companies define adjusted operating ratio differently. Because of these limitations, adjusted operating ratio should not be considered a measure of income generated by our business or discretionary cash available to us to invest in the growth of our business. Management compensates for these limitations by primarily relying on GAAP results and using non-GAAP financial measures on a supplemental basis.
Heartland Express, Inc. is a holding company. The Company, together with its subsidiaries, is a short, medium and long-haul truckload carrier and transportation services provider. It primarily provides a nationwide asset-based dry van truckload service for various shippers across the United States, along with cross-border freight and other transportation services offered through third party partnerships in Mexico. The Companyâs primary customers include retailers, manufacturers and parcel carriers. Its over-the-road tractors are equipped with mobile communication systems. It operates 31 terminal facilities throughout the contiguous United States and one in Mexico. The Companyâs subsidiaries include Heartland Express, Inc. of Iowa, Heartland Express Services, Inc., Heartland Express Maintenance Services, Inc., Midwest Holding Group, LLC, Millis Transfer, LLC, Smith Transport, Inc. and others.