- Highlights from the Mina Central Adit include:
- 512.5 g Ag/t & 14% Pb over 58m strike & average width of 0.5m (Level -40).
- 132.40 g Ag/t & 7.1% Pb over 117m strike & average width of 0.4m (Level -40).
- 153.7g Ag/t & 7% Pb over 20m strike & average width of 0.9m (Level -60).
- 223.9 g Ag/t & 5.0% Pb over 30m strike & average width of 0.7m (Level -80).
- 239.5 g Ag/t & 11% Pb over 125m strike & average width of 0.9m (Level -100).
- 242.5 g Ag/t & 11% Pb over 164m strike & average width of 0.9m (Level -100)
- 343.2 g Ag/t & 15% Pb over 40m strike & average width of 0.8m (Level -100).
- Underground artisanal workings were sampled over a strike extent of 2km with results from 368 samples reported in eight principal artisanal working areas.
- Areas of potential high grade Ag mineralization targets outlined from underground channel sampling correlate very well with strong chargeability anomalies.
- A relatively strong chargeability anomaly extending northwards from the Mina Central area for approximately 700m is a prime target for further drilling.
- Previously reported Hole DGL-01 that intersected 49.19 g Ag/t, 1.35% Zn & 1.31% Pb over 44.76m tested a deeper strong chargeability anomaly below Mina Central confirming potential for wider zones of higher-grade Ag mineralization at Gonalbert.
Dr.
UNDERGROUND CHANNEL SAMPLING
Table 1 lists the underground channel sampling and sample record for the Gonalbert property. A total of 368 channel samples were collected. Average sample width was 1.1m. Sampling was carried out along both the ENE and NNW-oriented drifts on the principal production levels, including Level 0, -40, -60, -80, -100, -125, -150, -160 and -180 at the Mina Central adit, and at the La Hoyada, Tacoyoj and
Table 1. Underground channel sampling and samples record at the Gonalbert property.
| LEVEL | SAMPLES COLLECTED | ASSAYS RECEIVED | ASSAYS PENDING | |
| MINA CENTRAL | 0 | 12 | 12 | 0 |
| MINA CENTRAL | -20 | 3 | 3 | 0 |
| MINA CENTRAL | -40 | 19 | 19 | 0 |
| MINA CENTRAL | -60 | 6 | 6 | 0 |
| MINA CENTRAL | -80 | 8 | 8 | 0 |
| MINA CENTRAL | -100 | 21 | 21 | 0 |
| MINA CENTRAL | -125 | 6 | 6 | 0 |
| MINA CENTRAL | -140 | 21 | 21 | 0 |
| MINA CENTRAL | -150 | 2 | 2 | 0 |
| MINA CENTRAL | -160 | 14 | 14 | 0 |
| MINA CENTRAL | -180 | 6 | 6 | 0 |
| LA HOYADA | 20 | 26 | 26 | 0 |
| LA HOYADA | 0 | 55 | 55 | 0 |
| LA HOYADA | -30 | 42 | 42 | 0 |
| 0 | 20 | 20 | 0 | |
| 0 | 13 | 13 | 0 | |
| RIELES | 0 | 26 | 26 | 0 |
| TACOYOJ | 0 | 15 | 15 | 0 |
| TACOYOJ 1 | 0 | 9 | 0 | 9 |
| CELIA | 0 | 27 | 27 | 0 |
| ISABEL | 0 | 17 | 17 | 0 |
| TOTAL | 368 | 359 | 9 | |
Systematic channel sampling was performed by cutting channels across the mineralized zone in the underground mine workings including the mine face, walls, and back. The area was first cleaned to remove dust, dirt, slime, and soluble salts. A linear horizontal channel was then cut between two marked lines at a uniform width and depth. The width was about 10 cm at a depth of 10 mm. Sample length varied depending on variation in mineralization but typically channels were between 1 and 2 m across the mineralized zone. The standard tools were hammer and a sharp pointed end chisel made of drill steel. While the sampler cuts the channel, a second person collected chips, fragments, and fines in a clean box, sack, or on a canvas sheet spread on the floor. A sample of 1 m length weighed approximately 1-2 kg which was then sent for assay.
Underground channel samples and drill samples are prepared in ALS Bolivia Ltda’s preparation facility in
DISCUSSION OF RESULTS
Table 2 summarizes the channel sample results from the major artisanal workings. Figure 1 is a geological map showing the main potential high grade Ag mineralization targets as indicated by channel sampling of underground workings. Figure 2 is a geological and sampling plan map of Mina Central, Level -40, the first level with high values of silver and Figure 3 is a geological and sampling map of Mina Central, Level -100.
Table 2. Summary of Underground Channel Sampling Results at Gonalbert property.
| UG Working | Level | Mineralized intervals | |||||
| No. of samples | Interval Length (m) | Average channel width (m) | Ag (g/t) | Pb (%) | Zn (%) | ||
| MINA CENTRAL GROUP 1 | 0 | 10 | 270 | 0.9 | 72.6 | 1.7 | 0.06 |
| MINA CENTRAL GROUP 2 | 0 | 2 | 37 | 0.9 | 22.3 | 0.8 | 0.01 |
| MINA CENTRAL | -20 | 2 | 12 | 1.7 | 137.2 | 4.6 | 0 |
| -20 | 1 | 12 | 0.8 | 52.3 | 1.4 | 0 | |
| MINA CENTRAL GROUP 1 | -40 | 7 | 58 | 0.5 | 512.5 | 14 | 0.02 |
| MINA CENTRAL GROUP 2 | -40 | 10 | 117 | 0.4 | 132.4 | 7.1 | 0.07 |
| MINA CENTRAL GROUP 3 | -40 | 1 | 9 | 0.2 | 47.8 | 3.1 | 0.02 |
| MINA CENTRAL | -60 | 4 | 20 | 0.9 | 153.7 | 7 | 0.02 |
| MINA CENTRAL | -80 | 5 | 30 | 0.7 | 488.3 | 13.4 | 0.02 |
| MINA CENTRAL GROUP 1 | -100 | 8 | 125 | 0.9 | 239.5 | 11 | 0.04 |
| MINA CENTRAL GROUP 2 | -100 | 10 | 164 | 0.7 | 242.5 | 10.7 | 0.05 |
| MINA CENTRAL GROUP 3 | -100 | 3 | 40 | 0.8 | 343.2 | 14.5 | 0.03 |
| MINA CENTRAL GROUP 1 | -125 | 2 | 13 | 0.3 | 563.6 | 14.5 | 7.7 |
| MINA CENTRAL GROUP 2 | -125 | 4 | 33 | 0.8 | 172.9 | 9.8 | 12.2 |
| MINA CENTRAL | -140 | 20 | 257 | 0.7 | 104.3 | 4.5 | 10.3 |
| MINA CENTRAL | -150 | 2 | 4 | 0.6 | 311.5 | 13.7 | 10.7 |
| MINA CENTRAL GROUP 1 | -160 | 4 | 136 | 1.2 | 135 | 5.5 | 17.4 |
| MINA CENTRAL GROUP 2 | -160 | 5 | 76 | 0.8 | 68.5 | 3.6 | 6.9 |
| MINA CENTRAL GROUP 1 | -180 | 2 | 64 | 0.9 | 216.8 | 8.8 | 2.8 |
| MINA CENTRAL GROUP 2 | -180 | 2 | 36 | 2.1 | 23 | 0.7 | 11.8 |
| QUIMBALETE ADIT GROUP 1 | 20 | 18 | 129 | 1.5 | 21.6 | 1.3 | 0.2 |
| QUIMBALETE ADIT GROUP 2 | 20 | 4 | 29 | 1 | 64.7 | 2.3 | 1.8 |
| MINA LA HOYADA GROUP 1 | 0 | 6 | 29 | 1.3 | 38.2 | 1.9 | 1.8 |
| MINA LA HOYADA GROUP 2 | 0 | 6 | 41 | 1.2 | 76.3 | 3.1 | 0.4 |
| MINA LA HOYADA GROUP 3 | 0 | 19 | 90 | 1.1 | 67.8 | 3.1 | 5 |
| MINA LA HOYADA GROUP 1 | -30 | 32 | 241 | 1.2 | 14.9 | 0.7 | 1.3 |
| MINA LA HOYADA GROUP 2 | -30 | 11 | 56 | 1.5 | 37.3 | 1.9 | 3.5 |
| 0 | 3 | 35 | 1.3 | 184.4 | 3.8 | 0.3 | |
| 0 | 17 | 97 | 1.4 | 33.1 | 1.2 | 0.2 | |
| 0 | 1 | 10.5 | 1.5 | 51.1 | 1.5 | 0.2 | |
| RIELES ADIT GROUP 1 | 0 | 8 | 44.5 | 1 | 31.1 | 1.4 | 0 |
| RIELES ADIT GROUP 2 | 0 | 5 | 15 | 1.8 | 46.4 | 2.1 | 0 |
| RIELES ADIT GROUP 3 | 0 | 4 | 22 | 1.3 | 88.8 | 1.1 | 0 |
| TACOYOJ ADIT | 0 | 15 | 98 | 1.4 | 20.3 | 0.6 | 0.01 |
| CELIA ADIT GROUP 1 | 0 | 17 | 93 | 1 | 49.3 | 2.5 | 0.03 |
| CELIA ADIT GROUP 2 | 0 | 6 | 48 | 1 | 60.2 | 1.8 | 0 |
| ISABEL ADIT | 0 | 15 | 61 | 1.2 | 133.9 | 4.7 | 0.1 |
Figure 1: Geological plan map showing locations of principal underground workings sampling and the main potential high grade Ag mineralization targets as indicated by results of channel sampling of underground workings.
Figure 2 – Geological and sampling map of Mina Central, Level -40, the first level with high values of silver
Figure 3 – Geological and sampling map of Mina Central, Level -100, with high values of silver across the level
RECONNAISSANCE
Three (3) holes totaling 1,364.8m were drilled on the Gonalbert property. As shown in Figure 1, Holes DGL-01 to DGL-03 were drilled in the southern side of the property. Drill holes were designed mainly to test geophysical and geological targets (Figure 2) for epithermal Ag-Pb-Zn mineralization (Figure 1 and Table 3).
Table 3. Diamond Drill Hole Coordinates at Gonalbert Property
| Hole No. | Easting | Northing | Elev. | Azimuth | Inclination | End of Hole |
| DGL-01 | 219000.0 | 7637460.0 | 3669.5 | 60° | -70° | 457.0 |
| DGL-02 | 219214.7 | 7637583.9 | 3581.8 | 60° | -70° | 275.5 |
| DGL-03 | 218742.2 | 7637542.2 | 3596.3 | 60° | -50° | 632.3 |
| TOTAL METERAGE | 1364.8 | |||||
Previously released Hole DGL-01 intersected 49.19 g Ag/t, 1.35% Zn, and 1.31% Pb over 44.76m which includes a higher-grade interval of 137.42 g Ag/t, 7.91% Zn and 5.6% Pb over 5.60m.
Other significant intersections in DGL-01 include:
- 57.74 g Ag/t and 1.75% Pb over 18.25m including 79.90 g Ag/t and 2.53% Pb over 6.63m
- 109.54 g Ag/t, 3.68% Zn and 4.44% Pb over 11.09m including 170.01 g Ag/t, 2.51% Zn and 7.00 % Pb over 5.81m
Drill hole DGL-02 did not intercept any significant mineralization and did not reach the designed targets because of difficult ground conditions (intense faulting).
Drill hole DGL-03, was drilled to test the Central Vein mineralization, intersecting some mineralized base metals intervals hosted in Ordovician sediments cut by tectonic breccias and dacitic dykes. This hole intersected widespread lower-grade sphalerite, galena, pyrite, siderite, and quartz in vein breccias, veins, veinlets, and dissemination. Significant results are listed in Table 4. Highlights are as follows:
- 32.0 g Ag/t, 4.16% Zn and 0.98% Pb over 0.5m.
- 89.4g Ag/t, 0.26% Zn and 2.99% Pb over 2.57m.
- 37.0g Ag/t, 1.25% Zn and 1.0% Pb over 0.5m.
- 36.0 g Ag/t, 1.2% Pb over 2.07m
Table 4. Significant Results of Hole DGL-03 at Gonalbert property,
| Hole No. | From (m) | To (m) | Length (m) | Ag | Au | Zn | Pb | Cu | Sn | Bi | Cd |
| g/t | g/t | % | % | % | % | % | % | ||||
| DGL-03 | 48.64 | 49.68 | 1.04 | 25.0 | 0.020 | 0.004 | 0.13 | 0.007 | 0.014 | 0.0005 | 0.0005 |
| 185.93 | 186.43 | 0.50 | 32.0 | 0.050 | 4.16 | 0.98 | 0.018 | 0.024 | 0.0040 | 0.0210 | |
| 262.30 | 265.38 | 4.63 | 7.36 | 0.076 | 0.082 | 0.064 | 0.050 | 0.008 | 0.0324 | 0.0005 | |
| 317.42 | 324.48 | 7.06 | 9.59 | 0.021 | 0.38 | 0.38 | 0.017 | 0.007 | 0.0016 | 0.0017 | |
| 402.20 | 403.73 | 1.53 | 7.00 | 0.005 | 0.30 | 0.21 | 0.002 | 0.012 | 0.0005 | 0.0020 | |
| 456.10 | 456.60 | 0.50 | 37.0 | 0.040 | 1.25 | 1.01 | 0.018 | 0.018 | 0.0150 | 0.0060 | |
| 470.56 | 473.13 | 2.57 | 89.4 | 0.026 | 0.26 | 2.99 | 0.016 | 0.014 | 0.0008 | 0.0011 | |
| 497.66 | 499.73 | 2.07 | 36.0 | 0.010 | 0.028 | 1.24 | 0.009 | 0.003 | 0.0010 | 0.0005 | |
| 592.24 | 596.1 | 3.86 | 25.0 | 0.010 | 0.004 | 0.13 | 0.037 | 0.015 | 0.0480 | 0.0005 |
Figure 4 shows the locations of potential high grade Ag mineralization targets on the n=4 chargeability grid that corresponds to a depth of approximately 100m below the surface. A strong chargeability anomaly extends northward from the Mina Central Area for approximately 700m and represents a priority target for drilling. Figure 5 is a chargeability section showing drill holes DGL-01 and DGL-02. DGL-01, which returned the most significant intersections intersected the deeper strong chargeability anomaly below Mina Central whereas hole DGL-03 was on the flank of this anomaly, explaining the relatively few intersections in this hole.
On the plan chargeability map in Figure 4, it is evident that there is gap in the mineralization or possible structural break between the deeper chargeability anomaly intersected in hole DGL-03 and the shallower chargeability anomaly to the north. This strong correlation of the chargeability anomaly with the significant intersection in hole DGL-01 and with the artisanal mine workings hosting high-grade Ag veins is very encouraging. This indicates that there is potential for much wider higher grade silver zones on Gonalbert.
Figure 4: Plan Map with Drill Holes Completed Showing Model Chargeability and Correlation of Chargeability with Potential High Grade Silver Target Areas Outlined by Underground Channel Sampling.
Figure 5: Cross Section of Model Chargeability with Drill Holes DGL-01 and DGL-02
Qualified Person
Dr.
Cartier Silver utilizes both ALS & AHK for drill core analysis, both of whom are major international accredited laboratories. Drill samples sent to ALS are prepared in both ALS Bolivia Ltda’s preparation facility in
Drill core samples sent to
About
Cartier Silver is an exploration and development Company focused on discovering and developing its recently acquired silver property assets, including the
For further information please visit Cartier Silver’s website at www.cartiersilvercorp.com
For further information please contact:
| Thomas G. Larsen | Jorge Estepa |
| Chief Executive Officer (800) 360-8006 (416) 360-8006 | Vice-President (800) 360-8006 (416) 360-8006 |
The CSE has not reviewed nor accepts responsibility for the adequacy or accuracy of this release.
Statements in this release that are not historical facts are “forward-looking statements” & readers are cautioned that any such statements are not guarantees of future performance, & that actual developments or results, may vary materially from those in these “forward-looking statements”.
Photos accompanying this announcement are available at:
https://www.globenewswire.com/NewsRoom/AttachmentNg/6aa84d4b-fbc0-4b14-ab8c-7777fa78bb5f
https://www.globenewswire.com/NewsRoom/AttachmentNg/a8738346-038d-427f-8904-68dd838cc37a
https://www.globenewswire.com/NewsRoom/AttachmentNg/74860622-f725-4265-8262-bcb0f8764f51
https://www.globenewswire.com/NewsRoom/AttachmentNg/4e175e15-9a5f-4f4f-8678-ef0fb3841a11
https://www.globenewswire.com/NewsRoom/AttachmentNg/cfb06404-9f16-48f4-8104-a67b89ae89f3
PDF available: http://ml.globenewswire.com/Resource/Download/efece325-d46c-4f8e-be67-c889c6f47ed3

![]()
Figure 1
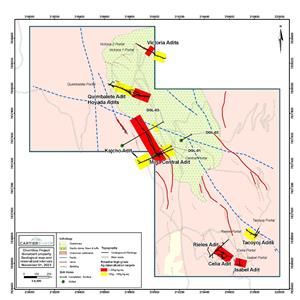
Geological plan map showing locations of principal underground workings sampling and the main potential high grade Ag mineralization targets as indicated by results of channel sampling of underground workings.
Figure 2
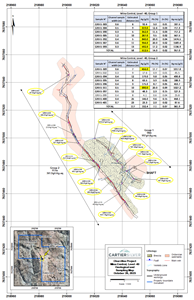
Geological and sampling map of Mina Central, Level -40, the first level with high values of silver
Figure 3
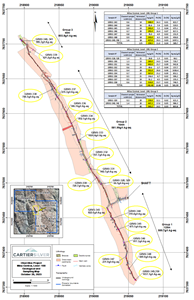
Geological and sampling map of Mina Central, Level -100, with high values of silver across the level
Figure 4
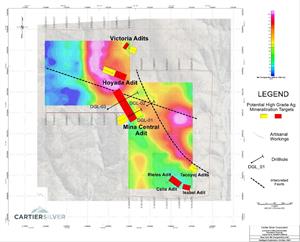
Plan Map with Drill Holes Completed Showing Model Chargeability and Correlation of Chargeability with Potential High Grade Silver Target Areas outlined by Underground Channel Sampling
Figure 5
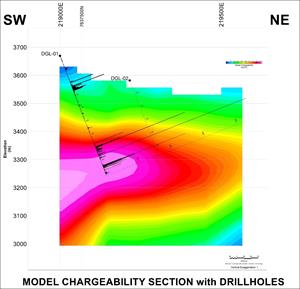
Cross Section of Model Chargeability with Drill Holes DGL-01 and DGL-02
2023 GlobeNewswire, Inc., source