Financial Overview
The Company achieved a significant increase in year-over-year quarterly revenue, culminating in positive net income for the quarter ending
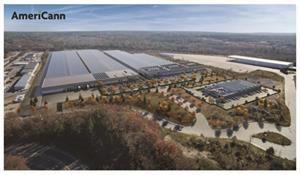
The increase in financial performance is attributable to greater revenue received from products produced and manufactured at Building 1, the Company's initial building at its Massachusetts Cannabis Center development in
Building 1 is a 30,000-square-foot cultivation greenhouse and processing facility that utilizes AmeriCann’s proprietary “Cannopy” cultivation system. Building 1 is fully occupied by
A summary of operational highlights included the following:
- AmeriCann’s Operating Revenue from Building 1 increased over 52% from the quarter ended
March 31, 2021 , to the quarter endingMarch 31, 2022 . - The Company achieved positive Adjusted EBITDA for the quarter of
$297,597 , an increase of 289% over the quarter endingMarch 2021 . Adjusted Operating EBITDA margins for the quarter were 44.6%. - The manufacturing of cannabis infused products, including the 1906 branded “Drops,” Howl’s Tincture, and Harpoon Extracts, have increased dramatically at the Massachusetts Cannabis Center. Sales of manufactured infused products are expected to be even stronger once the anticipated increase of production and sales for 1906 “Drops” are realized.
- For the months of December, January and February the 1906 branded “Drops” were the top selling edible product in the
Massachusetts market. Howl’s Tincture was the top selling brand in the Tincture Category. - AmeriCann’s tenant,
Bask, Inc. added adult-use retail sales in February of 2021 which has increased revenue from products produced at the Massachusetts Cannabis Center. - In
February 2022 , revenue from theMassachusetts cannabis market was$139.6 million which was 40% greater thanFebruary 2021 . - For the 2021 calendar year, revenue for the
Massachusetts cannabis market was$1.62 billion , 75% more than 2020 revenue. Experts believe the market will exceed$1.8 billion annually. - Total
Massachusetts cannabis sales have recently exceeded$3 billion since the inception of the Commonwealth’s regulated cannabis program.
See definitions of non-GAAP measures later in this release.
Management Commentary
“The success we have achieved with Building 1 is a testament to the quality of consistent products being produced for patients and consumers,” said
About
To learn more about the Massachusetts Cannabis Center click HERE to watch a short video.
Forward-Looking Statements
This press release contains “forward-looking statements” within the meaning of Section 27A of the Securities Act of 1933, as amended, and Section 21E of the Securities Exchange Act of 1934, as amended (the “Exchange Act”) (which Sections were adopted as part of the Private Securities Litigation Reform Act of 1995). Statements preceded by, followed by or that otherwise include the words “believe,” “anticipate,” “estimate,” “expect,” “intend,” “plan,” “project,” “prospects,” “outlook,” and similar words or expressions, or future or conditional verbs such as “will,” “should,” “would,” “may,” and “could” are generally forward-looking in nature and not historical facts. These forward-looking statements involve known and unknown risks, uncertainties and other factors which may cause the Company's actual results, performance or achievements to be materially different from any anticipated results, performance or achievements. The Company disclaims any intention to, and undertakes no obligation to, revise any forward-looking statements, whether as a result of new information, a future event, or otherwise.
About Non-GAAP Financial Measures
The Company uses "adjusted EBITDA," as a non-GAAP financial measure to evaluate financial performance such as period-to-period comparisons. This non-GAAP measure is not defined under
Reconciliation of Non-GAAP Financial Measures
The Company defines adjusted EBITDA as net income adjusted to exclude the impact of interest expense, interest income, income taxes, depreciation, depletion and amortization, stock based compensation, impairment, and the plus or minus change in fair value of derivative assets or liabilities. The Company believes adjusted EBITDA is relevant because it is a measure of cash flow available to fund capital expenditures and service debt and is a metric used by some industry analysts to provide a comparison of its results with its peers. The following table presents a reconciliation of the Company's non-GAAP financial measures to the nearest GAAP measure.
| Quarter Ending | |||||||||||||||
| Quarters ended | |||||||||||||||
| $ Change | % Change | ||||||||||||||
| Rental income - related party | $ | 667,366 | $ | 437,344 | $ | 230,022 | 53 | % | |||||||
| Net (loss) income | $ | 24,240 | $ | (304,092 | ) | $ | 328,332 | 108 | % | ||||||
| Interest income | (3,119 | ) | (4,780 | ) | 1,661 | 35 | % | ||||||||
| Interest expense | 151,089 | 259,669 | (108,580 | ) | -42 | % | |||||||||
| Interest expense - related party | 12,907 | 12,908 | (1 | ) | -0 | % | |||||||||
| Depreciation and amortization | 112,480 | 112,711 | (231 | ) | -0 | % | |||||||||
| EBITDA | $ | 297,597 | $ | 76,416 | $ | 221,181 | 289 | % | |||||||
| EBITDA | $ | 297,597 | $ | 76,416 | $ | 221,181 | 289.4 | % | |||||||
| EBITDA Margin | 44.6 | % | 17.5 | % | 96.2 | % | |||||||||
| Gross Margin | 98.4 | % | 97.5 | % | 0.9 | % | |||||||||
Contact Information:
Corporate:
info@americann.co
www.americann.co
@ACANinfo on Twitter
@AmeriCann on Facebook
@AmeriCannInc on Instagram
Corporate Communications:
InvestorBrandNetwork (IBN)
www.InvestorBrandNetwork.com
310.299.1717 Office
Editor@InvestorBrandNetwork.com
A photo accompanying this announcement is available at:
https://www.globenewswire.com/NewsRoom/AttachmentNg/9591d455-fd3f-43ca-8022-80bed35f189c

![]()
AmeriCann Reports Positive Quarterly Financial Results and an Operations Update
The Company achieved a significant increase in year-over-year quarterly revenue, culminating in positive net income for the quarter ending March 2022 .
2022 GlobeNewswire, Inc., source
