- EURUSD breaks trendline support
- NZDUSD .8100 Break Signals Near Term Trend Change
- USDCHF and EURUSD non-confirmations
--Friday’s DailyFX Plus webinar (video is titled Jamie’s Webinar 01-31-2014).
--Subscribe to Jamie Saettele's distribution list in order to receive a free report to your inbox once a day.
--Trading specifics are availabletoJ.S. Trade Desk members.
EUR/USD
Weekly
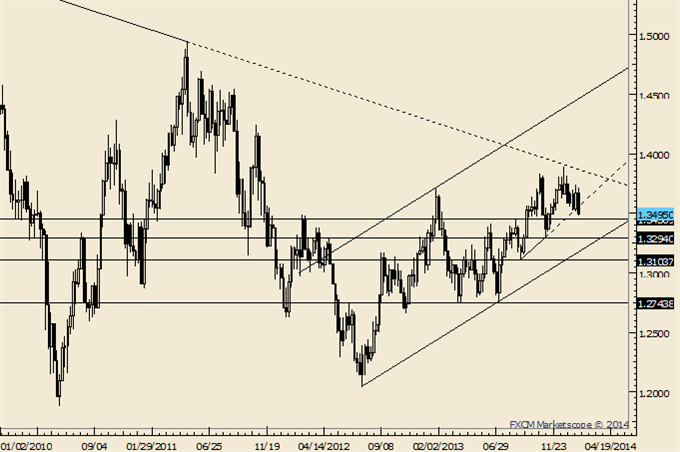
Chart Prepared by Jamie Saettele, CMT using Marketscope 2.0
Automate trades with Mirror Trader
-EURUSD remains capped by the trendline that connects the 2008 and 2011 highs. The break below the trendline that extends off of the September and November lows increases the probability that the late December high is significant.
-The late December failure also raises the possibility of a double top with the October and December highs. The pattern would trigger below 1.3294 and yield a 1.2757 objective. This level is in in line with the 2013 low.
-1.3550/70 is possible resistance next week. 1.3400 is possible support ahead of 1.3294.
GBP/USD
Weekly
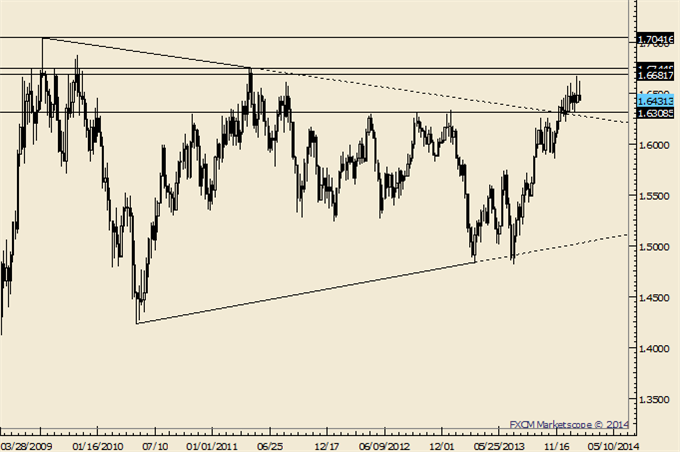
Chart Prepared by Jamie Saettele, CMT using Marketscope 2.0
Automate trades with Mirror Trader
-After trading to its highest level since April 2011 last week, GBPUSD carved a large outside day reversal. This is the kind of action that could lead to a larger top. Weakness below the line that extends off of the 2009 and 2011 highs and specifically 1.6308 would suggest as much.
-1.6400 remains potential near term support. 1.6500 is potential resistance next week.
AUD/USD
Weekly
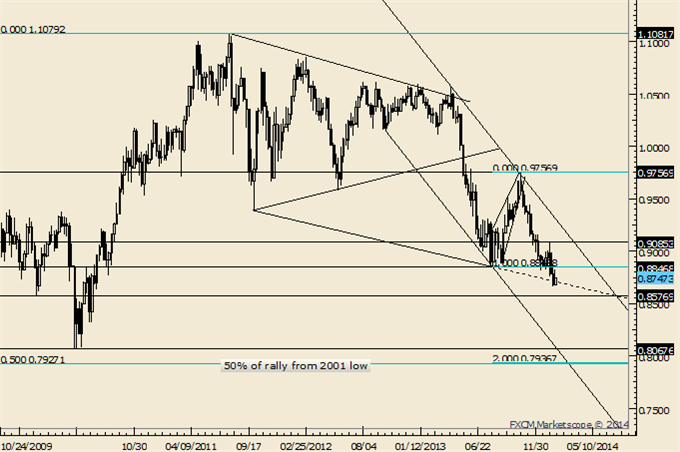
Chart Prepared by Jamie Saettele, CMT using Marketscope 2.0
Automate trades with Mirror Trader
-The next major target in AUDUSD is .7937. This target is determined by the .8847-.9757 range (.8847 – (.9757-.8847). Interestingly, the 50% retracement of the decline from the 2001 low registers at .7927. ‘Chartwise’, the 2010 low is at .8067. Significant demand may not exist until this zone.
-The market has followed through on the recent outside week. The implications are that the outside week serves as the ‘kick-off’ for the next leg of the bear.
NZD/USD
Weekly
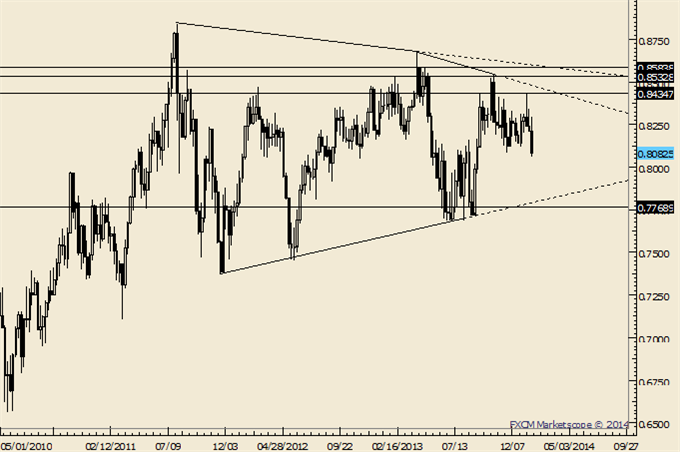
Chart Prepared by Jamie Saettele, CMT using Marketscope 2.0
Automate trades with Mirror Trader
-The drop below .8100 shifts focus lower towards long term triangle support around .7800. Former support at .8200 is now estimated resistance.
-Longer term trend remains sideways, possibly within the confines of a triangle (since 2011).
USD/JPY
Weekly
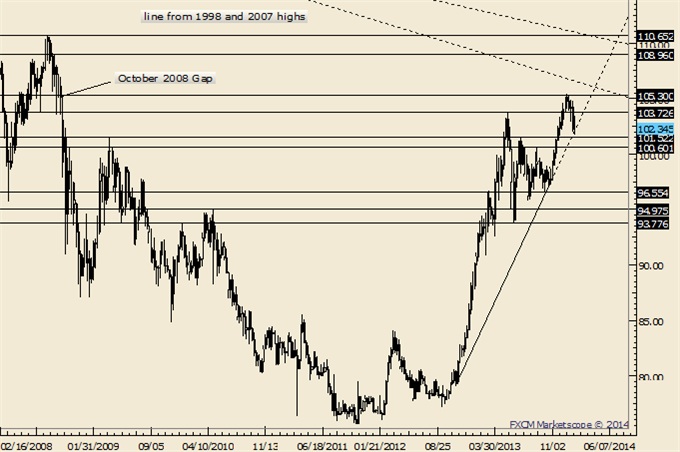
Chart Prepared by Jamie Saettele, CMT using Marketscope 2.0
Automate trades with Mirror Trader
-“USDJPY is respecting the gap from October 2008 at 105.30. This level and the outside day seen on January 2nd should at least warn of a pause in the uptrend.”
-USDJPY continues to hold the trendline that connects the lows from November 2012 and October 2013. As long as this line holds, it’s difficult to express a bigger picture bearish opinion although I’d also expect resistance at 103.85 in the event of a pop. 101.52 and 101.60 are levels to keep in mind as possible support if the trendline gives.
-Longer term, there is an Elliott case to be made for a return to the 4thwave of one less degree. The range spans 93.78 to 96.55.
USD/CAD
Weekly
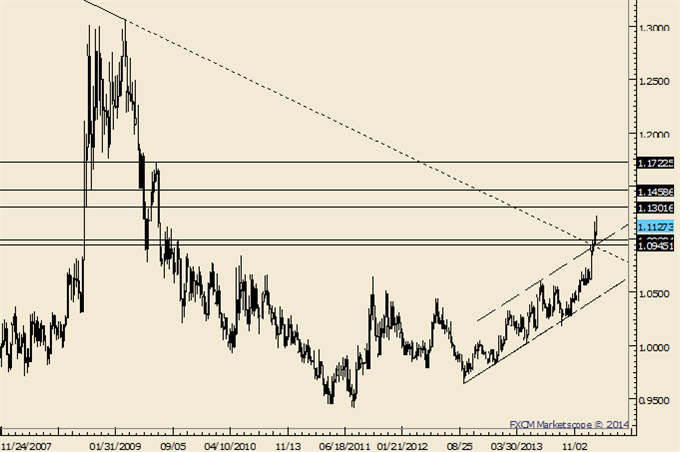
Chart Prepared by Jamie Saettele, CMT using Marketscope 2.0
Automate trades with Mirror Trader
-Measured objectives from the breakout above the 2011 high range from 1.1680 to 1.1910. The Jul 2009 high rests in this zone at 1.1724 and the 2007 high is near the top of the zone at 1.1875.
-From an Elliott perspective, it’s possible that the rally from the 2012 low composes a ‘3rd of a 3rd (or C)’ wave from the 2007 low.
-The close above the line that extends off of the 2002 and 2009 highs as well as the close above corrective channel resistance add credence to the 3rd of a 3rd wave position.
-1.0950-1.1030 is estimated support.
USD/CHF
Weekly
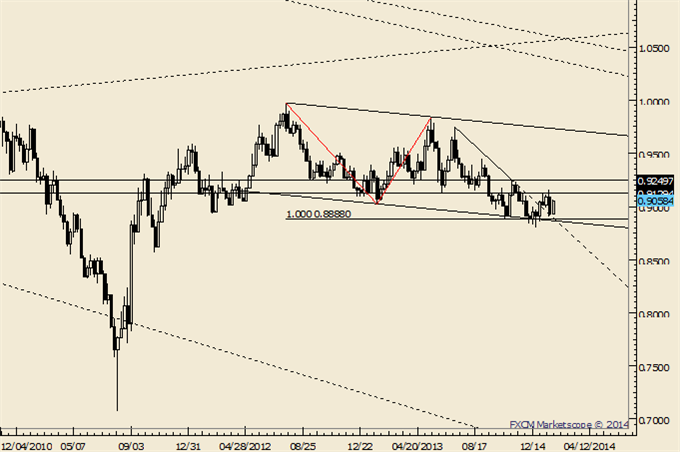
Chart Prepared by Jamie Saettele, CMT using Marketscope 2.0
Automate trades with Mirror Trader
-The USDCHF may have completed a corrective decline from the 2012 high in late December. The decline is in 3 waves, channels in a corrective manner (connect the origin of waves A and C and project a parallel from the terminus of wave A to project the terminus of wave C), and consists of 2 equal waves (would be exactly equal at .8888…the lowest weekly close was actually .8885).
-The break above the trendline that originates at the July high adds credence to a larger trend change but the rate remains capped by the June and August lows. Of concern as well is divergence between EURUSD (new low) and USDCHF (not a new high).
original source


