
Bottom line: Our outlook is neutral with a very cautious bias.
Before getting into fundamental and technical details on 12 precious metal miners like what we did a week ago when looking at 10 Oilers, some background is necessary.
Participants in capital markets fall into one of two categories. We are either investors or we are speculators. In both cases, we need at times to be traders.
Speculators, we can agree, are shorter-term oriented and mostly trend and cycle followers. Whether their style is active or passive management of funds, momentum-based trading is an important component of their work. Being mostly technically oriented, many speculators enjoy participating in the Exchange Traded Fund marketplace.
In our case, we are investors because we need to have a detailed understanding of companies and the causal factors that push and pull on their share prices. Over time as traders, we maneuver investments in our core long-term holdings among multiple favorable short-term entry and exit points as we endeavor to ensure safe and efficient fund usage.
We believe that not more than 10 to 15% of market participants – at least the human ones – are investors while the remainder are speculators. That is not to say that one category or the other is better. It’s only to say that it is what it is. Combined with algo trading, true investor participation in markets today is probably 5% or less.
When many of us started to participate in markets professionally several decades ago, securities regulators imposed what was called the Prudent Man Rule. Simply, we were required to be investors. Technical analysis was discouraged or at least required to play a minor role. Holding periods typically ran about three years with occasional interim trading of a portion of the instruments we held.
After financial service companies like Humongous Bank & Broker (HB&B) decided that a strategic move should move their clients away from the ‘dead’ money in mutual fund products to the ‘live’ money turnover in ETFs, the regulators seemed to find acceptance with speculation (i.e., the dropping of the Prudent Man requirement), technical analysis and momentum trading, and high turnover of portfolios. This paved the way for computer algorithms and high frequency trading (HFT).
The problems, which we saw from the beginning, stemmed from the fact that prices were being controlled and directed in such a way that capital markets no longer served as a price discovery mechanism. That in itself forced many investors to become speculators and for the many who refused there was the alternative of buying passive index-based ETFs. Most did in fact go that way.
Today, we think it fair to say that most market participants pay little attention to the research methodologies, analytical processes and valuation systems we use across global equity markets to, in the words of our colleague Harp Singh, “extract alpha by discovering blue oceans of value and potential growth”.
The bottom line is that most market participants do not understand or even try to understand why market prices rise and fall or if their money is invested in fundamentally weak companies or unsustainable industries. That is not a positive development for our society.
Investors on the other hand are subjected to many demands. To earn a respectable return on capital, we are required to have an astute understanding of macroeconomic dynamics, business cycles and ever evolving market players and investment platforms so that we may identify the underlying driving forces that contribute to sector and industry growth potential and the ability of some companies to thrive in different market conditions.
With that lengthy preamble, let’s start at the beginning. Over the past 100 years, capital market prices have been most impacted by central bank policy and now by what they term their open market operations that impose their policies. Central banks produce money and control money supply. Gold is a very close form of money, so central banks basically control the price of Gold as they do all exchangeable currencies.
Historically, in times of rising inflation, central banks tightened the money supply and raised the interest rates at which their agent banks could borrow and henceforth lend to the public. Without selling their Gold, central banks lend it to their agent banks at higher or lower interest rates that caused those banks to set their prices of buying and selling with the public. With cycles of inflation and monetary tightening, the price of Gold would rise. Long-cycle investors understood the process and were early to buy Gold to patiently hold it for up to ten years or more. As the price trend lifted, speculators would buy the short-cycle dips and try to carry a momentum wave to higher prices, selling to earn short-term gains.
That long-cycle Bull trend for Gold started in 2001 and ended in 2011. The central bank policies of low interest rates from 2007, and their Quantitative Easing programs that followed, provided the greatest boost to Gold prices that culminated in highs of around 1900 USD per ounce in 2011. Since that time, the price of Gold has been in a downtrend.
Today the U.S. Federal Reserve Bank has begun a new monetary contraction cycle. The Bank of Canada this past week has joined the Fed in tightening. Investors know that Bank of England and the European Central Bank must follow. The fact they are hesitating is causing the Euro and Pound Sterling to strengthen against the USD. The Gold price in USD is adjusting. Speculators have been quick to seize the opportunity to run the price of Gold higher.
However, as these gains are not based on macroeconomics (i.e., extreme inflation or deflation) or the central bank acknowledged need to reduce their balance sheets (i.e., monetary contraction), but on speculation-enhanced momentum, these gains are also likely to be short-lived.
Investors are not interested in guessing future “news” such as what may happen day to day in North Korea or in Washington’s White House under the current President. Speculators and newsletter writers are. Investors who have an interest in any asset are simply waiting for the current next long-cycle to begin. For Gold, they are awaiting the end of the Bear cycle, which like in the cycles for technology, healthcare, consumer products, energy and industrial metals, ends in pain for those speculators who got caught holding the bag when the game was over.
Investors are not long or short Gold today. We are waiting for the right catalyst to appear and take effect. That has not happened.
Gold production has been declining today for many reasons. Environmentalists, greedy governments, lack of capex due to the inability of Goldminers to borrow from HB&B and other factors have played a role. Meanwhile, most Goldminers have cut their costs with operating efficiencies and superior technology and they have enjoyed low energy and labor costs. Most of them can make a profit, a small one maybe, at 1200-1250 gold. Now the price of Gold is around 1350, possibly heading to as high as 1400, and many of the Goldminer boards of directors are considering hedging future production. Some are engaged in high stakes promotion to speculators, hoping to gain the M&A interest of predatory miners or sales or forward production royalties to companies like Franco-Nevada or Wheaton Precious Metals. Again, these are operators and promoters who, in seizing the opportunities that only present themselves on occasion during Bear cycles, are limiting the prospects of much higher Gold prices. And when the central banks become aligned in their monetary tightening policies to reduce the size of their balance sheets, the mid-term cycle top will then become suddenly apparent.
What most speculators do not seem to realize is that much of trading today is computer-driven wash trading. High volumes as printed are not real volumes being traded by investors seeking price discovery, i.e., the matching of market price to intrinsic value. So, when an algo-controlling price uptrend is over, it becomes an algo-controlling price downtrend. When speculators panic and investors fail to see good value, there is no price support. As we say, a Bull trend moves on a grinding path higher, but takes the elevator down. A few stops on the way down will produce speculator-driven ‘dead cat’ bounces, but the end will only present itself after speculators have suffered a lot of pain, enough in fact to offer sufficient investment value.
Investment value in Gold is likely at a low enough price that Goldminers want out of the business and their promoters turn to other assets that speculators at the time find more appealing. In the latter part of the 1990s, hundreds of Goldminer promoters in the heart of Goldmining promotion, Vancouver Canada, and we personally knew many hundreds at the time, turned to technology stocks and the Internet craze that had been developing. Then after the market crash of 2000 that collapsed the Internet fad, many of these promoters went quiet until the Gold Bull reappeared that year and the years following. Working people do have to make a living, so we are not being critical of promoters. They have a job to do. The best of them do an outstanding job and we are proud to personally know many of them.
So, let’s conclude. Are investors buying the Gold bounce today? Could the price of gold have started a new Bull? The answer is a resounding ‘no’. We are waiting for speculators to be screaming maximum pain, which we believe will occur down at the 1030-1080 price of gold level.
Are we interested in studying the goldminer industry at this time? The answer is ‘yes’ because volatility in the price of Gold may be so extreme that huge price swings present some trading opportunities that enable us to study the behavior of speculators. In addition, if there are speculators who want us to manage their Gold portfolio we can do that as well, given that we would expect to be very short-term traders and possibly long-short where clients want that.
To help our studies, we revert to the same type of Fundamental and Technical screens provided by big data services such as Thomson Reuters and 4-traders.com as we used a week ago when reporting on Oil and the Oilers, which in that case we like.
If you look at 10-year price charts of Goldmining companies, you will see that most are in mid-range but still close to long-cycle lows. Below is the popular GDX Goldminer ETF chart. In combination with our $GOLD price movement forecast, we believe there is downside probability to even the highest quality stocks in the sector given the most recent forecasts of central bank monetary policy for the next couple years.

If you study the presentations of the best managed of these companies, you will see valuable proven, probable and possible resource assets that analysts and investors will not give proper value to until they believe a long-cycle bottom has occurred and the Gold Bull uptrend has clearly commenced.
For the purposes of this article, we examined the corporate presentations, finances and operations of twelve companies that we consider to be well managed:
Barrick Gold Corp (ABX) (TSX:ABX)
Agnico Eagle Mines (AEM) (TSX:AEM)
Coeur Mining (CDE)
Franco-Nevada Corporation (FNV) (TSX:FNV)
Fortuna Silver Mines (FSM) (TSX:FVI)
Goldcorp Inc (GG) (TSX:G)
Hecla Mining (HL)
Kinross Gold (KGC) (TSX:K)
Newmont Mining (NEM)
Pan American (PAAS) (TSX:PAAS)
Royal Gold Inc (RGLD)
Wheaton Precious Metals (SLW) (TSX:SLW)
Eight of these stocks are also traded on the Toronto Stock Exchange.
There are probably 50 we could have included in this list. In any case, the seasoned corporate managers of these companies, from large to small, know more about precious metals mining than any Wall Street algo programmer or the people who pay those salaries and build those computer systems.
As portfolio managers, we must trade an exchange market price, but we also invest long-term in the assets of companies, including in this case the people and the in-situ mineral resources. We seek to discover companies that represent value opportunities and/or that have growth potential through their ability to increase production capacity at a reasonable cost or make precious metals discoveries around the world. Our investment process combines a top-down macro approach with bottom-up analysis applied by a research team that includes geology and mining backgrounds. We maneuver investments among multiple favorable entry and exit points as we endeavor to ensure safe and efficient fund usage.
As an investor in global mining opportunities for several decades, our associate Bill Cara has toured properties and been underground in mines across North America and built a large personal network within the gold mining industry. He is recognized as an investment leader in this asset class.
For various reasons, we do own shares of several Goldminers presently. Many miners are active in copper production and are benefiting from the +50% move in copper over the past year. Moreover, our gold mining positions are relatively small at present (short-term hedges) and we have no intention to purchase further Goldminer stocks on price strength.
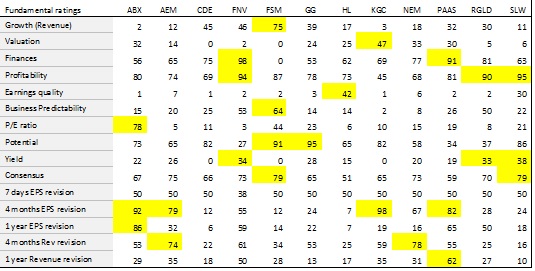
Briefly there are 15 fundamental ranking criteria and 6 technical rankings we reviewed using data at the close on September 7 (Thursday).
Fundamental Rankings:
- Revenue Growth, which is based on the evolution of the turnover of the company between the last year and the three coming years according to consensus estimates. The higher the growth is (from a relative viewpoint), the better the rating is. The goal is to rank companies according to estimated sales and to identify companies with the highest growth.
- Winners: only FSM
- Losers: ABX and KGC
- Valuation, which is based on the ratio between enterprise value and its turnover for the current fiscal year and the next one. The lower the valuation is, the better the rating is. The goal is to rank companies according to valuation and to identify companies with the lowest valuation.
- Winners: possibly only KGC
- Losers: CDE, FSM, FNV, RGLD and SLW
- Finances, which is based on the evolution of the net debt of the company (debt or cash) and its EBITDA, compared to its revenue. The higher the cash is, the better the rating is. The goal is to rank companies according to financial situation and to identify companies with the highest growth. The goal is to rank companies according to the quality of their financial situation.
- Winners: FNV and PAAS
- Losers: maybe FSM, but most Goldminer producers are in good financial shape
- Profitability, which is based on net margin of the company for the current year and the next one according to consensus estimates. The higher the ratio is, the better the rating is. The goal is to rank companies according to the “Net income/revenue” ratio to identify those which have a high payoff.
- Winners: the royalty streaming companies SLW, FNV and RGLD
- Losers: maybe only KGC, but most are relatively profitable
- Earnings Quality, which is based on quality of past earnings released by the company compared to analysts’ estimates. The better earnings release is, the higher the rating is. The companies closest to the consensus will have an average score. The goal is to identify companies that publish regularly above consensus.
- Winners: none, but HL is the best
- Losers: other than SLW, all of them are bad
- Business Predictability, which is based on the dispersion of analysts' estimates on the evolution of the company business in the coming years (range estimates). The more estimates are concentrated, the more the rating is high. The goal is to rank companies according to the predictability of their business and identify companies whose business is highly predictable.
- Winners: only FSM is good
- Losers: KGC and NEM are worst
- Price Earnings Ratio, which compared the company’s current share price to its per-share earnings for the current fiscal year and the next one. The lower the PER is, the better the rating is. The goal is to rank companies according to their earnings multiples and identify those which are cheap.
- Winners: only ABX excels when valued on PER basis
- Losers: other than ABX, the group is sub-par with FNV, AEM, HL and RGLD the worst
- Upside Price Potential, which is based on the average target price fixed by the consensus from Thomson Reuters. The higher the target price is, the better the rating is. The goal is to identify companies that have, according to analysts, the strongest upside potential.
- Winners: analysts believe GG and FSM have excellent price potential
- Losers: none really, but FNV, PAAS and RGLD are the lowest ranked
- Yield, which is based on the dividend relative to its share price. The higher the dividend yield is, the better the rating is. The goal is to identify companies that can supply a significant dividend return to their shareholders.
- Winners: none are good since Goldminers are not dividend plays, but SLW best
- Losers: many of them, including CDE, FSM and KGC (preserving capital is best)
- Consensus, which is based on analyst recommendations. It provides an indication of the position taken by most analysts polled by Thomson Reuters. The goal is to identify companies that benefit from the maximum of buy (or sell) recommendations.
- Winners: analysts seem to love the Goldminers with FSM and SLW the best
- Losers: none are bad, but HL is relatively lowest rated
- EPS revisions (one week), which is based on the evolution of EPS (earnings per share) revisions of the company for the current fiscal year and the next one. During the last week, more EPS estimates are revised upward (from a relative point of view), the more rating is high. The goal is to rank companies according to analyst estimates and to identify companies with the best EPS estimates.
- Winners: only FNV reported and it was essentially negative
- Losers: not applicable as none of the others reported last week
- EPS revisions (four months), which is based on the evolution of EPS (earnings per share) revisions of the company for the current fiscal year and the next one. During the last four months, more EPS estimates are revised upward (from a relative point of view), the more rating is high. The goal is to rank companies according to analyst estimates and to identify companies with the best EPS estimates. The difference is that the period of observation is based on fourth month instead of one week.
- Winners: KGC, ABX, PAAS and AEM were relatively good
- Losers: HL, CDE and FSM were worst
- EPS revisions (one year), which is based on the evolution of EPS (earnings per share) revisions of the company for the current fiscal year and the next one. The more EPS estimates are revised upward (from a relative point of view), the more rating is high. The goal is to rank companies according to analyst estimates and to identify companies with the best EPS estimates. The difference is that the period is three times as long as EPS revisions (four months).
- Winners: ABX was by far the best
- Losers: CDE and HL were bad and FSM, NEM, SLW and KGC not far behind
- Revenue revisions (four months), which is based on the evolution of revenue revisions of the company for the current fiscal year and the next one. The more revenue estimates are revised upward (from a relative point of view), the more rating is high. The goal is to rank companies according to analyst estimates and to identify companies with the best revenue estimates.
- Winners: only NEM and AEM showed real progress
- Losers: CDE, HL and RGLD were not good
- Revenue revisions (one year), which is based on the evolution of revenue revisions of the company for the current fiscal year and the next one. The more revenue estimates are revised upward (from a relative point of view), the more rating is high. The goal is to rank companies according to analyst estimates and to identify companies with the best revenue estimates. The difference is that the period is three times as long as Revenue revisions (four months).
- Winners: only PAAS was good
- Losers: GG, HL and CDE were bad
Technical Rankings (8 of the 12 had ratings):
- Short Term Timing, which is defined according to the positioning of the last closed trading price, within the area between the short-term support and resistance on the basis of technical analysis in daily data. A high score indicates the stock will be close to its short-term support and away from short term resistance. Conversely, a low score indicates the stock will be close to its short-term resistance and away from its short-term support.
- Winners: none, but ABX, AEM and FNV the best
- Losers: not surprisingly, CDE and HL were worst
- Mid-Term Timing, which is defined according to the positioning of the last closed trading price, within the area between the mid-term support and resistance on the basis of technical analysis in daily data. A high score indicates the stock will be close to its mid-term support and away from mid-term resistance. Conversely, a low score indicates the stock will be close to its mid-term resistance and away from its mid-term support.
- Winners: only FNV looks good
- Losers: RGLD and NEM
- Long Term Timing, which is defined according to the positioning of the last closed trading price, within the area between the long-term support and resistance on the basis of technical analysis in daily data. A high score indicates the stock will be close to its long-term support and away from long term resistance. Conversely, a low score indicates the stock will be close to its long-term resistance and away from its long-term support.
- Winners: only SLW was very good, followed by (surprise) HL
- Losers: MEG
- RSI rating, which is based on the ranking of the security in the panel studied according to the mathematical indicator RSI 14 period. The more the rating is high, the more the stock is in oversold position. Conversely, if the rating is low, it indicates a relative overbought situation.
- Winners: none because speculators have been chasing prices too high for an entry
- Losers: RGLD, NEM and CDE are worst, followed by HL
- Bollinger Bands rating, which is based on the ranking of the security in the panel studied according to the spread of the Bollinger bands. The higher the rating is, the closer Bollinger bands are. Thus, prices are in an indecision area that could cause an upwards or downwards acceleration. Conversely, the lower the rating is, the wider Bollinger Bands are and recent volatility is significant.
- Winners: FNV and ABX
- Losers: CDE and HL the lowest rated
- Abnormal Volumes rating, which is based on the ranking of the security in the panel studied according to volume of the last session compared to an average session. The more the rating is high, the more volumes were unusually high. Conversely, the more the rating is low, the more volume were unusually low.
- Winners: speculators were turning over lots of CDE this week
- Losers: only RGLD

Quantitative data as shown above illustrates comparative rankings across the broad spectrum of stocks in different industries across the world. From our perspective, we look for outliers that may reflect opportunities that need to be considered from an investment perspective.
The use of Big Data is part of our research and decision-making process. More important is the study of corporate presentations, latest financial reports and Management Discussion & Analysis (MD&A) of the companies on our watch list. In the case of Goldminers, we believe that the Prospector & Developers Association of Canada (PDAC) in Toronto in early March each year is the not-to-miss convention. The PDAC is attended by some 25,000 or more people from all over the world, including hundreds of trade exhibitors. The mining company booths are free to attend and the CEO’s, geologists and IR staff are always available for anybody to meet. Save the date (March 4-7, 2018). Maybe we’ll meet you there.
In two weeks, we plan to review from our investor perspective one or two of the Goldminer companies to explain in detail why they could become a part of your portfolio, obviously at the right time.
Next week, we revert to our original plan to follow up with a study of one or two Oilers.


