- Testing results at 50 cycles of GEN2 material show an overall capacity improvement of approximately 30% compared to the graphite benchmark and 14% better compared to Gen 1 material, without any noticeable cycle degradation [1].
“These results continue to showcase our ability to produce a blend of graphite and advanced silicon anode material that can be seamlessly integrated into existing anode manufacturing facilities, improving overall battery performance,” stated Dr.
UNLOCKING ENHANCED BATTERY PERFORMANCE WITH SILICON BASE ANODE MATERIALS
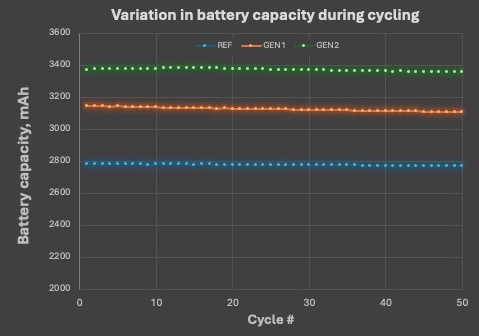
Figure 1) The blue line shows average capacity of 100% graphite batteries, the orange line shows average capacity of GEN1 batteries, and the green line shows average capacity of GEN 2, all measured in milliampere-hours (mAh) [1]
The figure above illustrates the progression in battery capacity over 50 cycles. The blue line represents the average capacity of three (3) 18650 batteries with 100% graphite at around 2,775 mAh. The orange line shows the average capacity of three (3) 18650 batteries using Novacium GEN1 materials at around 3,174 mAh. Finally, the green line depicts the average capacity of three (3) 18650 batteries using Novacium GEN2 materials at around 3,379 mAh.
These results indicate that during the first 50-cycle test, the batteries made with Novacium non-optimized GEN2 materials continue to show approximately a 30% improvement compared to the graphite benchmark and about a 14% improvement compared to the batteries made with Novacium GEN1 materials.
DELIVERING MINIMAL BATTERY DEGRADATION AT 50 CYCLES

Figure 2) The blue line shows the relative capacity of 100% graphite batteries, the orange line shows the relative capacity of GEN1 batteries, and the green line shows relative capacity of GEN 2, over 50 cycles [1].
Results from Figure 2 continue to demonstrate a minimal increase (about 1%) in measurable cycle degradation during the first 50 cycles. The blue line represents the average relative capacity of three (3) 18650 batteries with 100% graphite; the orange line shows the average relative capacity of three (3) 18650 batteries made using Novacium GEN1 materials, and the green line depicts the average relative capacity of three (3) 18650 batteries using Novacium GEN2 materials.
“Novacium’s non-optimized second-generation engineered silicon anode material continues to deliver results that surpass those obtained with Novacium GEN1 materials. These promising results have real-world applications,” stated Mr.
REFERENCE SOURCES
| [1] | Novacium technical team analysis of the data from the ongoing charging and discharging cycle tests conducted at a world-leading university, the name of which is kept confidential for competitive reasons. |
About NOVACIUM SAS
Novacium is an HPQ - affiliated company started in Q3 2022. This green technology startup is based in
About
HPQ is developing, with the support of world-class technology partners PyroGenesis Canada Inc. and NOVACIUM SAS, new green processes crucial to make the critical materials needed to reach net zero emissions.
HPQ activities are centred around the following four (4) pillars:
| 1) | Becoming a green low-cost (Capex and Opex) manufacturer of Fumed Silica using the FUMED SILICA REACTOR, a proprietary technology owned by HPQ being developed for HPQ by PyroGenesis. | |
| 2) | Becoming a producer of silicon-based anode materials for battery applications with the assistance of NOVACIUM SAS. | |
| 3) | ||
| 4) | Becoming a zero CO2 low-cost (Capex and Opex) producer of High Purity Silicon (2N+ to 4N) using our PUREVAPTM “Quartz Reduction Reactors” (QRR), a proprietary technology owned by HPQ being developed for HPQ by PyroGenesis. |
For more information, please visit
Disclaimers:
This press release contains certain forward-looking statements, including, without limitation, statements containing the words "may", "plan", "will", "estimate", "continue", "anticipate", "intend", "expect", "in the process" and other similar expressions which constitute "forward-looking information" within the meaning of applicable securities laws. Forward-looking statements reflect the Company's current expectation and assumptions and are subject to a number of risks and uncertainties that could cause actual results to differ materially from those anticipated. These forward-looking statements involve risks and uncertainties including, but not limited to, our expectations regarding the acceptance of our products by the market, our strategy to develop new products and enhance the capabilities of existing products, our strategy with respect to research and development, the impact of competitive products and pricing, new product development, and uncertainties related to the regulatory approval process. Such statements reflect the current views of the Company with respect to future events and are subject to certain risks and uncertainties and other risks detailed from time-to-time in the Company's ongoing filings with the security’s regulatory authorities, which filings can be found at www.sedar.com. Actual results, events, and performance may differ materially. Readers are cautioned not to place undue reliance on these forward-looking statements. The Company undertakes no obligation to publicly update or revise any forward-looking statements either as a result of new information, future events or otherwise, except as required by applicable securities laws.
Neither the
This News Release is available on the company's CEO
Source:
For further information contact:
Email: Info@hpqsilicon.com
Photos accompanying this announcement are available at:
https://www.globenewswire.com/NewsRoom/AttachmentNg/c1ff69cb-193c-4ef3-9780-d70022a37971
https://www.globenewswire.com/NewsRoom/AttachmentNg/6bf87fae-058c-4fde-9fe8-21e3480a7d09

![]()
Batteries Capacities
Figure 1) The blue line shows average capacity of 100% graphite batteries, the orange line shows average capacity of GEN1 batteries, and the green line shows average capacity of GEN 2, all measured in milliampere-hours (mAh) [1]
Loss of Capacity
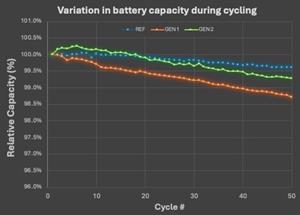
Figure 2) The blue line shows the relative capacity of 100% graphite batteries, the orange line shows the relative capacity of GEN1 batteries, and the green line shows relative capacity of GEN 2, over 50 cycles [1].
2024 GlobeNewswire, Inc., source


