Daily
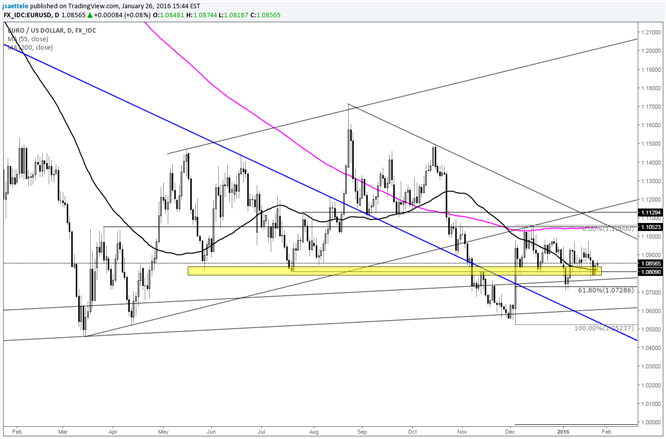
Chart Prepared by Jamie Saettele, CMT
Automate trades with Mirror Trader and see ideas on other USD crosses
-The 20 day range (about a rolling month) stands at 1.69%. This is the tightest range since early December 2014. Several weeks later, EUR/USD dropped from above 1.24 to nearly 1.11 in about 5 weeks. Point is, strong trends tend to succeed tight ranges. Pay attention to SSI, which may help ‘catch’ the move. As always, reward/risk is paramount.
For more analysis and trade setups (exact entry and exit), visit SB Trade Desk
original source


