Talking Points
- GBP/USD rebounds off key support
- AUD/USD closes over important resistance
- USD/JPY recovers from critical area
To receive other reports from this author via e-mail, sign up to Kristian’s e-mail distribution list via this link.
Looking for real time Forex analysis throughout the day? Try DailyFX on Demand.
Foreign Exchange Price & Time at a Glance:
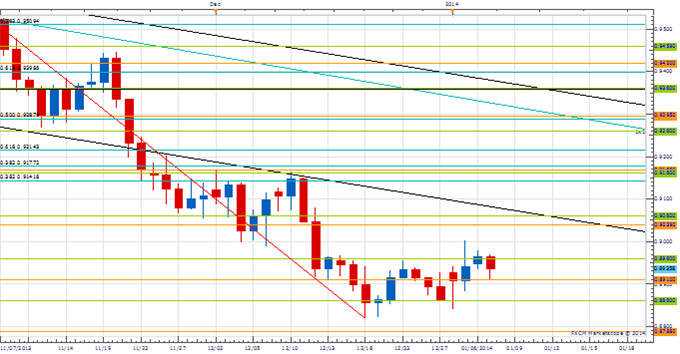
Price & Time Analysis: GBP/USD

Charts Created using Marketscope – Prepared by Kristian Kerr
- GBP/USD rebounded yesterday from the 2nd square root relationship of the year-to-date high near 1.6340
- Our near-term trend bias is negative on Cable while below 1.6600
- The 1.6340 level remains an important near-term pivot with weakness below needed to trigger a more material move lower
- Minor cycle turn windows are seen around the middle of this week and early next week
- Only a daily close over 1.6600 would turn us positive on the Pound
GBP/USD Strategy: Like selling Cable into strength.
Instrument | Support 2 | Support 1 | Spot | Resistance 1 | Resistance 2 |
GBP/USD | 1.6295 | *1.6340 | 1.6410 | 1.6475 | *1.6600 |
Price & Time Analysis: AUD/USD
Charts Created using Marketscope – Prepared by Kristian Kerr
- AUD/USD has moved only modestly higher since reversing from the 9th square root relationship of the October high near .8860 last week
- However, Monday’s close over .8960 has shifted our near-term trend bias to higher
- The .8960 remains an important near-term pivot with traction over this level exposing a key Gann convergnece near .9030/60
- A minor cycle turn window is seen over the next couple of days
- A daily close under .8860 is required to shift our trend bias back to negative in the Aussie
AUD/USD Strategy: Like the short side while under 1243.
Instrument | Support 2 | Support 1 | Spot | Resistance 1 | Resistance 2 |
AUD/USD | *.8860 | .8910 | .8930 | *.8960 | .9030 |
Focus Chart of the Day: USD/JPY
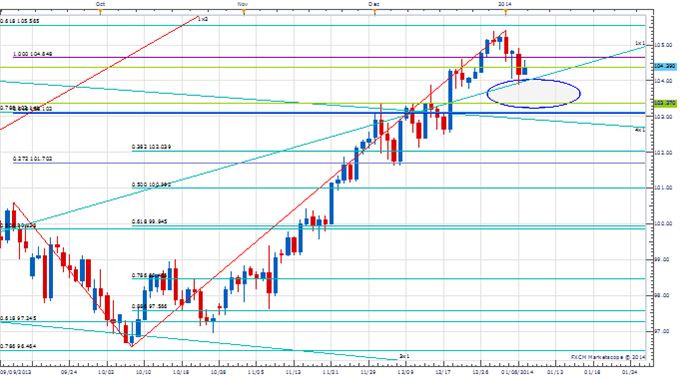
The extreme one way sentiment in USD/JPY (DSI touched just 7% bulls in the Yen on December 27th) finally caught up with it last week as the exchange rate failed just shy of a key long-term retracement at 105.55. The correction that followed has been relatively mild so far and it is still up in the air as to whether this move lower is just a correction of an overbought condition or the start of a more meaningful reversal lower. A Gann line related to the 2011 low comes into play around 103.90 (Monday’s low) while the 2nd square root relationship of the year-to-date high is near 103.35. These two levels look critical over the next few days. Any material weakness below the latter will turn the technical outlook much more negative. A move back over 105.00 is needed to relieve immediate downside pressures, but only traction over 105.55 signals the start of another material leg higher.
To receive other reports from this author via e-mail, sign up to Kristian’s e-mail distribution list via this link.
--- Written by Kristian Kerr, Senior Currency Strategist for DailyFX.com
This publication attempts to further explore the concept that mass movements of human psychology, as represented by the financial markets, are subject to the mathematical laws of nature and through the use of various geometric, arithmetic, statistical and cyclical techniques a better understanding of markets and their corresponding movements can be achieved
To contact Kristian, e-mail kkerr@fxcm.com. Follow me on Twitter @KKerrFX
original source


