Talking Points
- Cycle turn windows in several commodity currencies
- USD/JPY rebounds off 200-day MA
- SPX closing in on important upside pivot
To receive other reports from this author via e-mail, sign up to Kristian’s e-mail distribution list via this link.
Focus Chart of the Day: USD/CAD
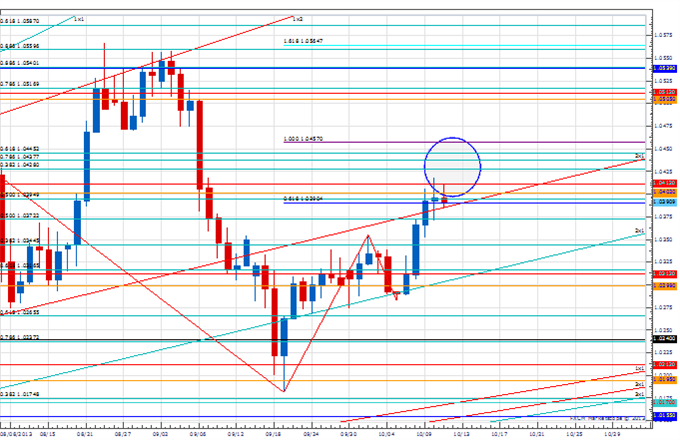
The next couple of days look important for several commodity currencies as clear cycle turn windows exist in USD/CAD, NZD/USD and USD/NOK. Our best guess is that these windows will lead to a bout of currency strength (USD weakness) given the trend profiles leading into them. In USD/CAD we will be focusing on Gann and Fibonacci resistance between 1.0410 and 1.0455 as we suspect this area should hold if a topping process is indeed paying out. Complicating matters somewhat is a slew of Canadian data over the next few sessions, but as long as this zone holds on a daily close basis the potential remains for a peak in our view. Weakness under 1.0370 would be seen as initial confirmation of a high.
Foreign Exchange Price & Time at a Glance:
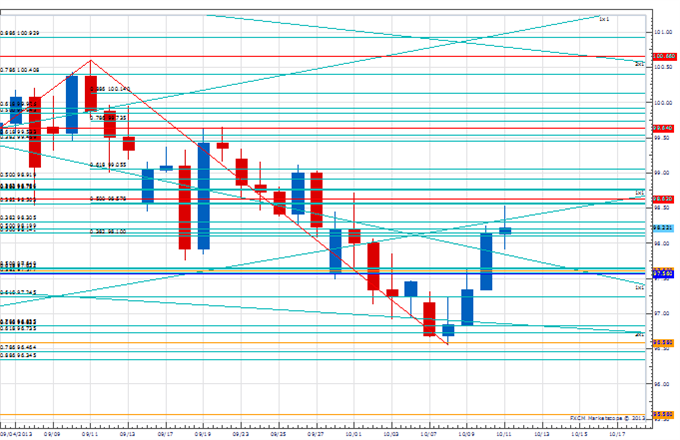
Price & Time Analysis: USD/JPY
Charts Created using Marketscope – Prepared by Kristian Kerr
- USD/JPYhas rallied aggressively over the past few days after finding support at the 7th square root progression of the year’s high in the 96.60 area
- While below 98.60, our near-term trend bias remains lower in the rate
- A daily close back under Gann support at 97.55 is needed to re-invigorate downside prospects
- A minor cycle turn window is seen on Monday
- A daily close over the 5th square root progression of the year’s high at 98.60 will turn us positive on the rate
USD/JPY Strategy: Might be worth taking a punt on the short side against 98.60 over the next few days. We will start looking to position long on any daily close over that level.
Instrument | Support 2 | Support 1 | Spot | Resistance 1 | Resistance 2 |
USD/JPY | 97.20 | *97.60 | 98.25 | *98.60 | 99.05 |
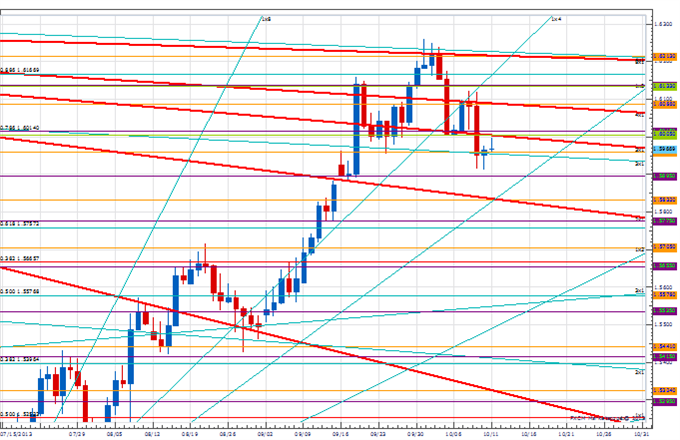
Price & Time Analysis: GBP/USD
Charts Created using Marketscope – Prepared by Kristian Kerr
- GBP/USD has come under increasing pressure over the past few days and closed under the 2nd square root progression of the month-to-date high near 1.6000 on Wedensday
- This technical development has shifted our near-term trend bias to negative in Cable
- A Gann pivot is seen around 1.5895 with a break below exposing downside attractions at 1.5830 and below
- A minor cycle turn window is seen over the next day or so
- It would take strength back above the 1st square root progression of the October high at 1.6135 on a daily closing basis to turn us positive Cable
GBP/USD Strategy: We like selling into strength while the rate is below 1.6135.
Instrument | Support 2 | Support 1 | Spot | Resistance 1 | Resistance 2 |
GBP/USD | *1.5840 | 1.5895 | 1.5965 | 1.6020 | *1.6135 |
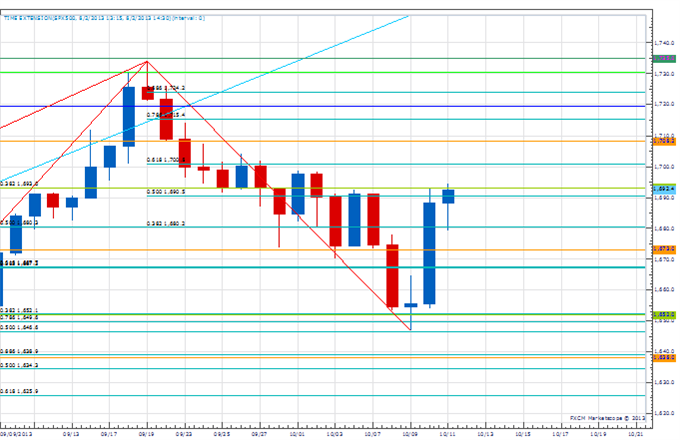
Price & Time Analysis: S&P 500
Charts Created using Marketscope – Prepared by Kristian Kerr
- S&P 500 rebound from the 1652 2nd square root progression of the all time high gathered pace on Thursday
- The 1st square root progression of the all time high come into play at around 1692 and a daily close over this level is needed to shift the near term trend bias back to higher
- Interim support is seen around 1673, but a daily close under 1652 is really needed to provoke something more meaningful on the downside
- A minor cycle turn window is seen around the middle of next week
- A daily close over 1692 will turn us positive on the index
S&P 500 Strategy: Square here, but may look to get long if index can close over 1692.
Instrument | Support 2 | Support 1 | Spot | Resistance 1 | Resistance 2 |
S&P 500 | *1652 | 1673 | 1692 | *1692 | 1710 |
--- Written by Kristian Kerr, Senior Currency Strategist for DailyFX.com
This publication attempts to further explore the concept that mass movements of human psychology, as represented by the financial markets, are subject to the mathematical laws of nature and through the use of various geometric, arithmetic, statistical and cyclical techniques a better understanding of markets and their corresponding movements can be achieved
Looking for a way to pinpoint sentiment extremes in real time? Try the Speculative Sentiment Index.
To contact Kristian, e-mail kkerr@fxcm.com. Follow me on Twitter @KKerrFX
original source


