Talking Points
- EUR/USD inching towards next key support zone
- Kiwi approaching important upside pivot
- 1Q14 looks cyclically significant for the S&P 500
To receive other reports from this author via e-mail, sign up toKristian’s e-mail distribution list via this link.
Looking for real time Forex analysis throughout the day? Try DailyFX on Demand.
Foreign Exchange Price & Time at a Glance:
Price & Time Analysis: EUR/USD
Charts Created using Marketscope – Prepared by Kristian Kerr
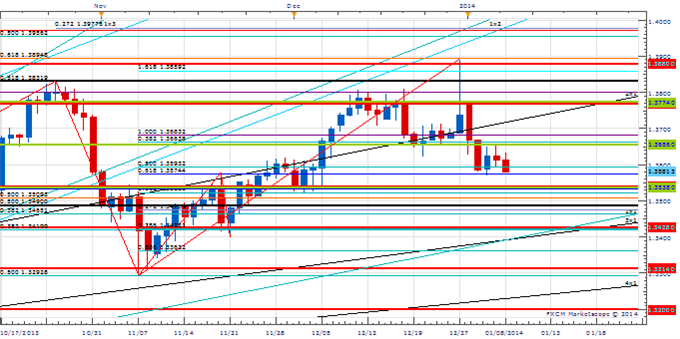
- EUR/USD has come under steady pressure since failing late last month at a long-term retracement near 1.3900
- Our near-term trend bias is negative on the Euro while below 1.3800
- The 3rd square root relationship of the 2013 high at 1.3540 remains the next significant downside attraction for the exchange rate
- A minor cycle turn window is seen today and early next week
- Only a daily close over last year’s closing high near 1.3800 would turn us positive on the Euro again
EUR/USD Strategy: Like the short side while below 1.3800.
Instrument | Support 2 | Support 1 | Spot | Resistance 1 | Resistance 2 |
EUR/USD | 1.3490 | *1.3540 | 1.3580 | 1.3655 | 1.3775 |
Price & Time Analysis: NZD/USD
Charts Created using Marketscope – Prepared by Kristian Kerr
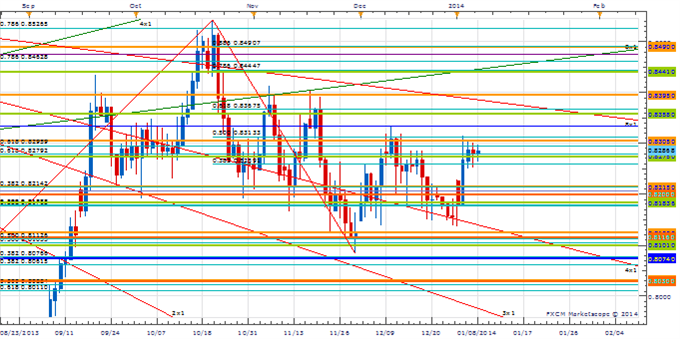
- NZD/USD has moved steadily higher since finding support last week near the 4x1 Gann angle line of the 2012 closing high
- Our near-term trend bias is higher while over .8185
- Key resistance looks to be the 4th square root relationship of the 2013 high at .8305 with strength above needed to confirm the start of a more important move higher
- A minor cycle turn window is seen today
- A daily close below the 4th square root relationship of the October high at .8185 would turn us negative on the Kiwi
NZD/USD Strategy: Like the long side over .8185.
Instrument | Support 2 | Support 1 | Spot | Resistance 1 | Resistance 2 |
NZD/USD | *.8185 | .8215 | .8285 | *.8305 | .8355 |
Focus Chart of the Day: S&P 500
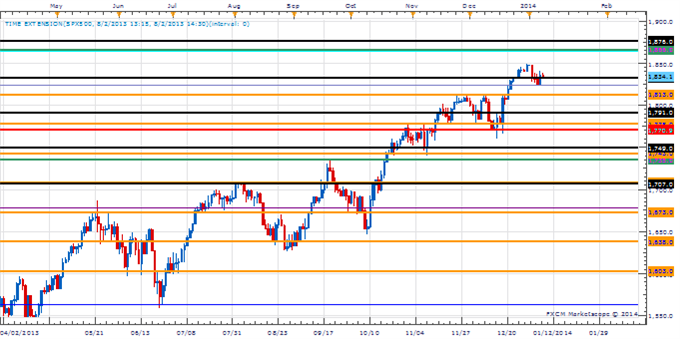
A variety of long-term Gann and Fibonacci price relationships converge between 1815 and 1875 in the S&P 500. Given several measurements of positive sentiment are now at extremes not seen in three decades; a top of some magnitude looks likely in the near future. Timing such things is obviously the difficult part. That said, the first quarter of 2014 looks particularly important for the index from a time cycle perspective with important turn windows seen during the last week of January, early February and the middle of March. Should the index be making new highs into these time periods we will become very suspicious and probably outright bearish. A multi-day close over 1875 risks some sort of blow off move higher, but this still looks like the less likely scenario.
To receive other reports from this author via e-mail, sign up toKristian’s e-mail distribution list via this link.
--- Written by Kristian Kerr, Senior Currency Strategist for DailyFX.com
This publication attempts to further explore the concept that mass movements of human psychology, as represented by the financial markets, are subject to the mathematical laws of nature and through the use of various geometric, arithmetic, statistical and cyclical techniques a better understanding of markets and their corresponding movements can be achieved
To contact Kristian, e-mail kkerr@fxcm.com. Follow me on Twitter @KKerrFX
original source


