The last 12 months have been a tumultuous period for holders of the precious metals, and these two technical setups seem to indicate the hard times are not yet over.
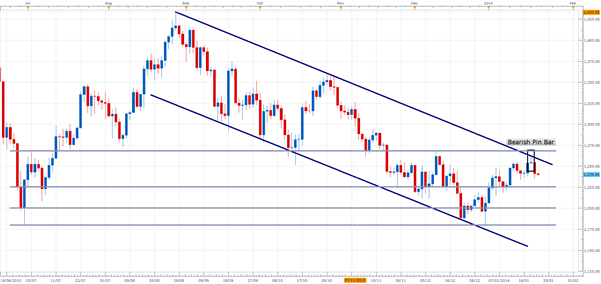
XAU/USD Daily Chart
XAU/USD has been ranging between a solid downward channel since the middle of August last year, and at the end of October presented Gold shorts with a nice, low risk entry point around the 1,350.00 flat level.
Since this potential entry, the trend has continued and both the upper and lower channel lines have held strong. At the start of this week, price touched the upper channel and again looks to be offering Gold shorts with another relatively low risk entry. Resistance from both the upper channel line and a support turned resistance dating back to July last year suggests confluence, which is the coming together of two or more signals. Generally, confluence raises the probability of trade success. Resistance from both of these levels defines the risk, as a substantial break above 1,264-1,275.00 would invalidate the channel and, in turn, its inferred downside bias.
When trading key levels such as these, it is best to look for some sort of confirmation before entering a trade. An example of confirmation came on Monday, with the day’s price action forming a bearish pin bar. A bearish pin bar forms when a session’s trading opens and closes at a similar level, but rises considerably during the session before falling back down to its close. The underlying theory behind a bearish pin bar is that buyers entered the market and drove price up, but were unable to take control and sellers were able to drive the price back down before the session close. Sellers keeping control in this way suggests they will hold control and the price of the asset in question will fall. Again, this bearish pin bar not only serves to confirm a bearish bias, but also adds confluence to a trade with three indications (channel resistance, key flat level resistance and bearish price action) that the downtrend is likely to continue.
A key level to watch over the next few days and weeks will be 1,225.00, which as a round number could provide a psychological barrier to any further downside. If price breaks through this level, the next one-to-watch will be around 1,200.00, another key psychological level. Interestingly, $1,200.00 is also the price below which many gold mining companies are unable to operate profitably. Beyond there, look for channel and key level support around 1,175.00.
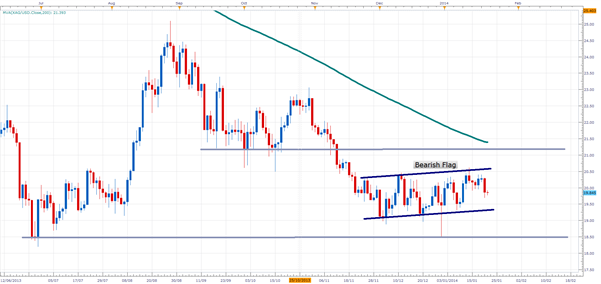
XAG/USD Daily Chart
Throughout the majority of the latter half of 2013, XAG/USD hit, but failed to break through key support at 21.10-20. The level finally broke mid-November, and price has yet to recover. A 200 SMA indicates the dominant trend is down, and with such key support finally broken this trend could be set to continue. Since early-December, price has been in something of a consolidation phase, ranging between around 19.00 and just below 20.50 at a slight upwards sloping angle. An upwards sloping consolidation like this, when it appears in a downtrend, is called a bearish flag.
Bearish flags form as traders cover earlier shorts and swing traders position themselves for reversals, which makes for choppy, range bound action. Price touched the flag’s upper channel early last week and is now edging down towards the lower channel; a level that it might hit as soon as next week. The important thing to remember is that even though bearish flags offer up a downside bias, they do not help you determine when a downtrend might resume. Price might range between the upper and lower channel for weeks or even months before doing so.
To trade this pattern, look for a break of the lower channel as confirmation. The pattern completes only when price breaks, and closes, below the lower channel. More risk averse traders might wait for a retest after the breakout. Often after breaking a key level, price will return to that level and ‘retest’ it. If the level holds, this is extra confirmation that the pattern’s bias is accurate. In this example, you would look for price to break the lower channel, trade below it, pull back up and reverse once again as the lower channel acts as resistance.
If the breakout does occur, key levels to watch will be the psychologically relevant 19.00 flat and beyond that 18.50, which has held as support both at the end of December and as far back as June last year. Importantly, note that each time price has hit this 18.50 level it has reversed sharply. Be careful if you are looking to trade to the downside beyond this level.
original source


