Market volatility has taken a bite out of Americans’ personal financial satisfaction. With a reading of 30.9, the AICPA’s Q4 2018 Personal Financial Satisfaction Index (PFSi) declined for the first time in seven quarters, ending its five-quarter run of consecutive record highs. The unfavorable fourth quarter wiped out 24 percent of the index’s gains from the three prior 2018 quarters. This is only the fourth time the index has decreased since climbing from an all-time low of -42.0, set in Q3 2011. Even with the decline, the PFSi is still very solidly in positive territory, and relatively close to recent record highs.
This press release features multimedia. View the full release here: https://www.businesswire.com/news/home/20190124005017/en/
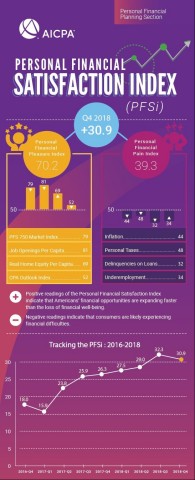
Q4 2018 PFSi Infographic (Graphic: Business Wire)
The PFSi is calculated as the Personal Financial Pleasure Index (Pleasure Index) minus the Personal Financial Pain Index (Pain Index), with positive readings signaling that Americans are feeling more financial pleasure than pain. The Q4 2018 PFSi measured 30.9, a 1.4-point (4.4 percent) decrease from the prior quarter, the second largest quarterly decrease to the PFSi in seven years (behind only the 2.1-point drop in Q1 2017). The decrease was due to a 4.1-point decline in the Pleasure Index outweighing a slight boost from a 2.6-point decrease in the Pain Index (a decline in the Pain Index improves the PFSi overall).
The Pleasure Index, at 70.2, is down 4.1 points (5.5 percent) from the previous quarter, ending eleven quarters of consecutive gains, the last nine of which were all record highs. The pullback was primarily driven by a 13.4 point (14.5 percent) drop in the PFS 750 Market Index, an AICPA proprietary stock index comprised of the 750 largest companies trading on the US Market adjusted for inflation and per capita. The fourth quarter turned 2018 into a bruising year for the market, the worst since 2008. All sectors declined, wiping out all of the PFS 750 gains from the three prior quarters and dropping the index to just below the Q4 2016 value. The worst losses were in Energy, followed by Industrials. Utilities had the most modest losses. As a result of the sharp quarterly decline, the PFS 750 Market Index is no longer the biggest contributor to financial pleasure for the first time in almost a decade (Q2 2009).
“The recent stock market decline is a good reminder to focus on the long-term goals of your financial plan, and don’t let yourself be influenced by the prevailing financial winds,” said Dave Stolz, CPA/PFS member of the American Institute of CPAs’ PFS Credential Committee. “Even with the recent market turbulence, economic conditions overall in the US remain strong.”
Along those lines, the Job Openings Per Capita Index, now the largest contributor to the Pleasure Index for the first time since Q2 2001, decreased 0.2 points (0.3 percent) from the prior quarter. With the negligible drop, it is still holding near the Q3 2018 record high. The increase from one year-ago was 12.2 points (17.9 percent), which included gains in almost every sector. The final December 2018 job numbers have not yet been released by the Federal Reserve, but measuring through November, 2018 is on pace to set a new record for job creation. After 11 months, 2018 is averaging 870,000 jobs added a month. The biggest year on record for added jobs was 2015, with an average of 802,000 jobs added each month.
The Pain Index, at 39.3, saw three factors decrease from the previous quarter, combining to drop the index 2.6 points. The decrease from the preceding quarter was led by an 8.9 point (17.0 percent) drop in the Inflation index which is now at its lowest rate since February 2018 and no longer the leading contributor to the Pain Index-- that’s a title reclaimed by personal taxes. The Q4 Inflation Index, which relies on the Federal Reserve’s November level, is 1.8 percent, still below the Federal Reserve’s 2 percent target for inflation.
The Tax Cuts & Jobs Act (TCJA) has now been reflected in the PFSi for four quarters. Thanks in part to inflations quarterly decline, pain from personal taxes is once again the leading contributor to financial pain-- a title it has held eight of the last ten quarters. However, compared to the year-ago level, pain from taxes is down 4.5 points (8.7 percent). In Q1 2018, the first quarter to show the TCJA impact, pain from personal taxes dropped 4.14 points from the Q4 2017 level of 52.08 to the Q1 2018 reading of 48.15. Since then, the 2018 quarterly level has been approximately flat. Amongst other statistics, this factor uses information from the Bureau of Labor Statistics on income tax, tax on realized net capital gains and taxes on personal property.
“Early in 2018, the IRS updated the withholding tables as a result of the TCJA tax rate changes. In many cases, the Federal withholding decreased which resulted in Americans seeing a bit more money in each paycheck. However, those that didn’t check their withholding may be surprised by a smaller than usual refund, or worse yet, a balance due,” said Julie Welch, CPA/PFS member of the American Institute of CPAs’ Personal Financial Planning Executive Committee.
Last year, Americans received an average tax refund of $2,899, according to the IRS. This year, with household debt at an all-time high of $13.51 trillion, it is a good thing that more than a quarter of Americans plan to use their upcoming tax refunds to help pay off debt.
“The government shutdown has brought increased attention to the need for an emergency fund as we are reminded that many Americans live paycheck to paycheck. Imagine being without the necessary funds to pay normal living expenses, such as mortgage or rent payments and car payments, or unexpected expenses, such as a tax bill from the IRS. It’s a good idea to use at least part of a tax refund to pay down debt and start an emergency fund so if someone does happen to unexpectedly find themselves out of work or with an unexpected expense, they can help avoid negative financial consequences,” added Welch.
Loans Delinquencies dropped 2.4 points (6.9 percent) from Q3, with the improvement mostly related to mortgages. This factor’s current level is 18.7 percent lower than the prior year level and is at its best level since the end of 2007. Though the current reading of delinquencies on mortgages (3.01 percent) is well below the peak delinquency rate for mortgages (11.26 percent) set in the spring of 2010, it is still above what was typical between 1994 through 2003 (2.12 percent).
Additional Findings from the Q4 2018 PFSi:
- The AICPA CPA Outlook Index, which captures the expectations of CPA executives in the year ahead for their companies and the U.S. economy, decreased 2.8 points (5.1 percent) from the previous quarter. In fact, all components showed quarterly declines, led by US Economic Optimism. At its Q4 2018 reading of 52, the index is the same value as Q1 2017. Though it did decline, the index is still solidly in positive territory.
- The Real Home Equity Per Capita index, based on data issued for July, is 4.6 percent above the prior year value and 0.2 percent ahead of the previous quarter level. It is still 11.5 percent below its 2006 all-time high. The changes in value have been due to increases in the market value of real estate, which for the most recent reading came in just over 6 percent per annum.
- Underemployment, at 34 points, is 2.1 points (5.9 percent) lower than the prior year level and 1.1 point (3.2 percent) above the Q3 level. In comparison, its peak value was 84.3 corresponding to 17.1 percent in the fourth quarter of 2009 (versus the current 7.6 percent). It is now 10 percent below its average value in the two years before the great recession.
Additional information on the PFSi can be found at: www.aicpa.org/PFSi.
Methodology
The Personal Financial Satisfaction Index (PFSi) is the result of two component sub-indexes. It is calculated as the difference between the Personal Financial Pleasure Index and the Personal Financial Pain Index. These are comprised of four equally weighted factors, each of which measure the growth of assets and opportunities, in the case of the Pleasure Index, and the erosion of assets and opportunities, in the case of the Pain Index.
About the AICPA’s PFP Division
The AICPA’s Personal Financial Planning (PFP) Section is the premier provider of information, tools, advocacy, and guidance for CPAs who specialize in providing estate, tax, retirement, risk management, and investment planning advice to individuals, families, and business owners. The primary objective of the PFP Section is to support its members by providing resources that enable them to perform valuable PFP services in the highest professional manner.
CPA financial planners are held to the highest ethical standards and are uniquely able to integrate their extensive knowledge of tax and business planning with all areas of personal financial planning to provide objective and comprehensive guidance for their clients. The AICPA offers the Personal Financial Specialist (PFS) credential exclusively to CPAs who have demonstrated their expertise in personal financial planning through testing, experience and learning, enabling them to gain competence and confidence in PFP disciplines.
About the American Institute of CPAs
The American Institute of CPAs (AICPA) is the world’s largest member association representing the CPA profession, with more than 431,000 members in 137 countries and territories, and a history of serving the public interest since 1887. AICPA members represent many areas of practice, including business and industry, public practice, government, education and consulting. The AICPA sets ethical standards for its members and U.S. auditing standards for private companies, nonprofit organizations, federal, state and local governments. It develops and grades the Uniform CPA Examination, offers specialized credentials, builds the pipeline of future talent and drives professional competency development to advance the vitality, relevance and quality of the profession.
The AICPA maintains offices in New York, Washington, DC, Durham, NC, and Ewing, NJ.
Media representatives are invited to visit the AICPA Press Center at www.aicpa.org/press.
About the Association of International Certified Professional Accountants
The Association of International Certified Professional Accountants (the Association) is the most influential body of professional accountants, combining the strengths of the American Institute of CPAs (AICPA) and The Chartered Institute of Management Accountants (CIMA) to power opportunity, trust and prosperity for people, businesses and economies worldwide. It represents 667,000 members and students across 184 counties and territories in public and management accounting and advocates for the public interest and business sustainability on current and emerging issues. With broad reach, rigor and resources, the Association advances the reputation, employability and quality of CPAs, CGMAs and accounting and finance professionals globally.
View source version on businesswire.com: https://www.businesswire.com/news/home/20190124005017/en/


