Talking Points:
- US Dollar Soars to the Strongest Level in 4 Months
- S&P 500 Recovers, Moves to Test 2013 Yearly High
- Crude Oil Rises as Expected, Gold Inching Lower
Can’t access to the Dow Jones FXCM US Dollar Index? Try the USD basket on Mirror Trader. **
US DOLLAR TECHNICAL ANALYSIS – Prices are testing above resistance at 10727, the December 20 high. A break above this barrier exposes 10761, the intersection of the 38.2% Fibonacci expansion and the top of a rising channel set from early November. Reversing below support at 10707, the 23.6% level, exposes the channel bottom at 10635.
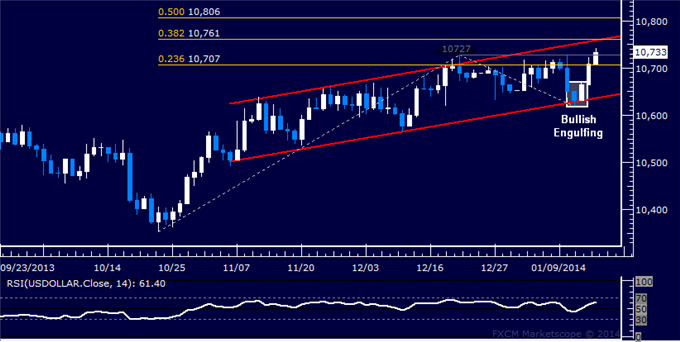
Daily Chart - Created Using FXCM Marketscope 2.0
** The Dow Jones FXCM US Dollar Index and the Mirror Trader USD basket are not the same product.
S&P 500 TECHNICAL ANALYSIS – Prices are testing resistance in the 1844.90-49.10 area, marked by the December 31 high and the 14.6% Fibonacci expansion. A break higher exposes the 23.6% level at 1863.10. Near-term support is at 1819.60, the 14.6% Fib retracement.
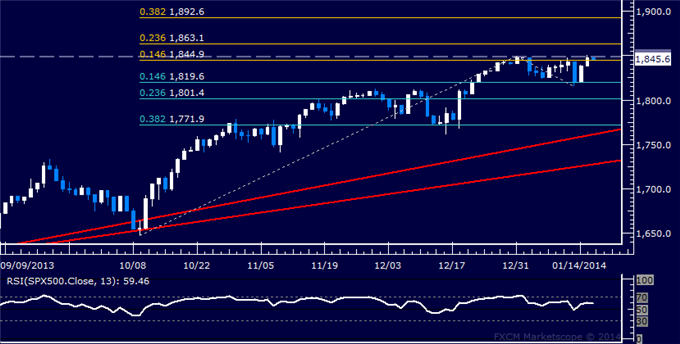
Daily Chart - Created Using FXCM Marketscope 2.0
GOLD TECHNICAL ANALYSIS – Prices are edging lower after putting in a Bearish Engulfing candlestick pattern. Breaking below support at 1240.12, the January 3 high, exposes the 1212.03-17.75 area (marked by the December 2 low and the 23.6% Fib expansion). Near-term resistance is at 1261.28, the October 11 low.
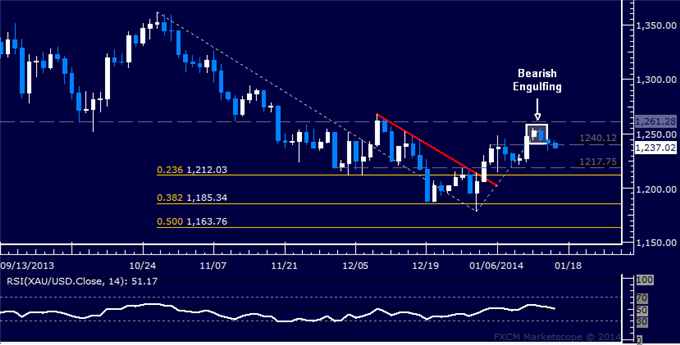
Daily Chart - Created Using FXCM Marketscope 2.0
CRUDE OIL TECHNICAL ANALYSIS– Prices pushed higher as expected after putting in a bullish Piercing Line candlestick pattern. A push above resistance at 94.85, the 38.2% Fibonacci retracement, exposes the 50% level at 95.97. Reversing below support at 93.46, the 23.6% Fib, aims for the January 9 low at 91.21.
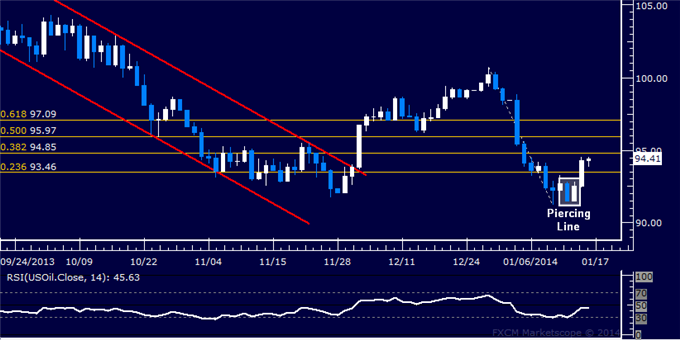
Daily Chart - Created Using FXCM Marketscope 2.0
--- Written by Ilya Spivak, Currency Strategist for DailyFX.com
To receive Ilya's analysis directly via email, please SIGN UP HERE
Contact and follow Ilya on Twitter: @IlyaSpivak
original source


