Main Points:
- S&P 500 retreats from all-time high on Thursday
- Resistance being noted at 1845 & 1863, Support seen around 1810 & 1800
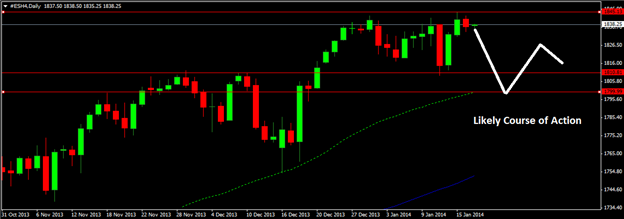
- Market poised for Lower Low (LL) before printing a Lower High (LH)
- Bearish ABCD pattern obvious on monthly chart
- Investors eye FOMC January meeting
After hitting 1845.25, a new all-time high level, S&P 500 pulled back on Thursday as financial companies disappointed investors with their earnings.
Goldman Sachs Group Inc. (GS.N) quarterly report revealed 21% reduction in earnings. Profit of Citigroup also missed expectations. Following the earning releases, stocks of Goldman and Citigroup slid down by 2% and 4.4% respectively thus dragging the S&P 500 financial index lower by 0.6%.
It is however pertinent that some other financial institutions such as JPMorgan Chase & Co (JPM.N), Bank of America Corp (BAC.N) and Wells Fargo & Co (WFC.N) had posted positive readings a few days back.
S&P 500 that closed at 1837 yesterday is likely to face immediate hurdle at 1845 which is 161.8% fib level of December 9 to December 16 rally and swing high of Wednesday. A break and close above this level would be targeting 1863, 261.8% fib level of September 15 to October 6 rally.
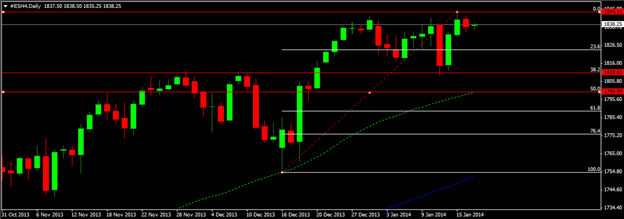
On downside, support is seen around 1810, a historical resistance turned support zone. A close below this level may aggravate the downside risk targeting 1800, 50% fib level as shown below;
Keeping in view 30% gain in 2013, the US stock market is poised for much needed correction. Recent improvement in labor sector, better than expected growth in third quarter and hawkish stance by FOMC policy makers in December meeting have also reinforced the bearish view for S&P 500 in near future.
The stock market has to print a Lower Low (LL), as shown in the above daily chart, in order to turn our bias negative. Then in retracement phase a Lower High (LH) would confirm the bearish reversal just as painted above.
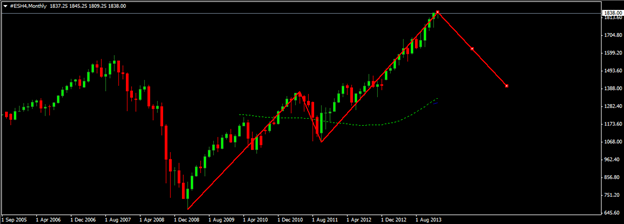
If we look at bigger picture, it also highlights much awaited correction that may begin in near future as you can see above; a classic bearish ABCD pattern is obvious on monthly chart.
Meanwhile, Federal Reserve’s outgoing chairman Ben Bernanke, who led the US economy in worst recession since 1930s, on Thursday defended Fed’s accommodative monetary policy over a past few years saying that Quantitative Easing (QE) is working quite well and poses no risk of creating bubbles in risk assets.
To those critics who consider Federal Reserve responsible for hyperinflation, Bernanke said they should look at today’s Consumer Price Index (CPI) report released by labor department that shows a rise in CPI by 1.5% in previous year which is well below Fed 2% target.
It is pertinent that investors are very cautious ahead of Federal Open Market Committee (FOMC) meeting which is scheduled on January 28-29. The President of Richmond Federal Reserve Jeffrey Lacker said on Friday the policymakers are expected to discuss yet another tapering in monthly asset purchase program by $10 billion.
original source


