Unimpressive data = falling rates = gold gaining strength
Area 3 % of T -Bond could coincide with the low of gold
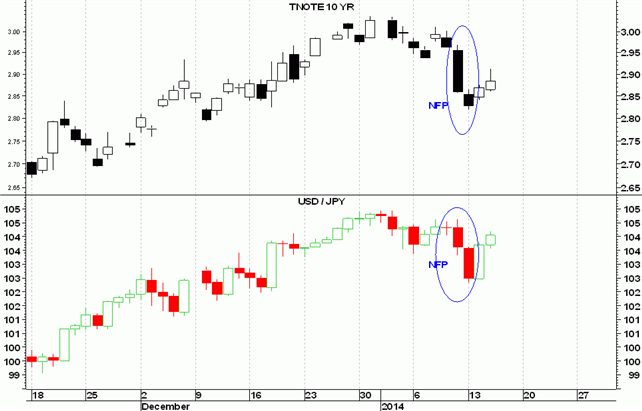
The reaction of gold after the release of disappointing U.S. employment data (74.000 jobs created in December compared to the expectation for almost 200.000 new hires), has coincided with an equally positive reaction on the part of the long term Americans bonds.
The yield on the 10-year U.S. government bond has dropped more than 10 basis points up to 2.85% (it had reached 3% the day before the release of the data), while gold has risen by more than $25 an ounce, reaching 1250.
This movement explains in good part what the owners of gold have to hope to revise an upward restart in prices.
Since gold is a financial product without a coupon or dividend, it can provide a positive return in the context of negative real interest rates, or at least with a trend pointing to negative real interest rates. This condition has been abandoned by the American economy in late 2012, when the U.S. real rates came back into a positive territory starting a trend capable of bringing the spread between 10-year yields and inflation to the current 165 basis points.
This can not be considered a historically high value as the historical average for the last 40 years was 260 basis points, but it is a negative data for gold which has to compete with very attractive real bond yields to those who have to invest.
The consequence of all this is a fall in the price of gold every time there are new positive macro data (more growth and thus higher rates and tapering speeds up), while a recovery in prices is felt when the macro data turn out to be disappointing or in case of a restart of the inflation (currently at 1.2%).
If we analyze in details the graphical structure of gold, a theoretical low could have formed at 1180, and quotes have become protagonists in the first week of 2014 of a reversal bullish outside bar, that seems to confirm the importance of the support already reached during the heavy sell- off in late June.
A first test of the strength of this movement will be represented by the down trend line that joins the decreasing highs of August and October 2013 (1280) which would be followed, in case of a bullish break, by the more important test of the resistance offered by the 200-day moving average at 1320.
The technique of the Ichimoku cloud is particularly reliable when applied to Forex and spot precious metals and the chart on weekly scale helps us with this.
In the early months of 2013, a clear bearish signal started with the clear violation of the cloud by the price which, from that moment forward, has never actually managed to close below the base line (blue line).
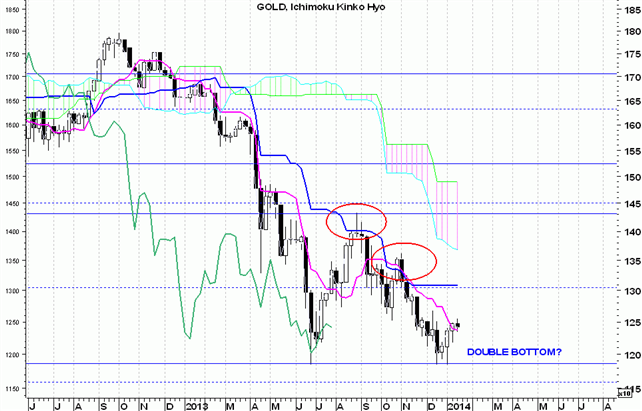
On a couple of occasions, the market tried to cross this resistance, but the angry reaction of the bearish side formalized two typical bearish reversal candle known as shooting star (in August ) and bearish engulfing pattern (in November).
Therefore, we can reasonably expect a market that is now gradually moving away from 1180 to try the assault to the base line currently located at 1308 (so close to the 200-day moving average ), but the thickness of the cloud leaves us perplexed about an immediate success in the trend reversal attempt by the gold.
Considering that the downward movement started in 2012 from 1796 and culminated in 1180 was equal to approximately 1.618 times the preceding movement of decline from 1921 to 1526, we can not exclude the fact that the one started in June 4 represents a wave of consolidation that is preparatory to a new (and last?) swooping down, maybe to the technical level of support of 1087; here is the 50 % of retracement of the entire bull market started at the beginning of the twenty-first century.
original source


