Explosive gains in the stock market and a decline in underemployment overcame rising inflation to advance Americans’ personal financial satisfaction to its highest level in the 24-year history of the AICPA’s Personal Financial Satisfaction Index (PFSi). The new high reached by the Q4 2017 PFSi, released today, eclipses the previous record reached last quarter and continues a run of seven consecutive quarters the PFSi has increased.
This press release features multimedia. View the full release here: http://www.businesswire.com/news/home/20180125005018/en/
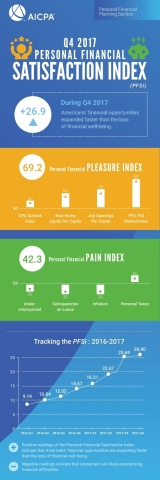
Q4 2017 PFSi (Graphic: Business Wire)
The PFSi is calculated as the Personal Financial Pleasure Index minus the Personal Financial Pain Index, with readings greater than zero signaling that Americans are feeling more financial pleasure than pain. The Q4 2017 PFSi measured 26.9, a 1.2-point increase from the prior quarter. The increase was due to a slight gain (1.3 points) in the Personal Financial Pleasure Index outweighing a modest (0.1 point) increase in the Personal Financial Pain Index.
The Personal Financial Pleasure Index, at 69.2, is up 1.3 points from the previous quarter, continuing its steady increase, setting a record for the fourth quarter in a row. The PFS 750 Market Index, up 5.2 percent, experienced the largest increase over the previous quarter and was only somewhat offset by a 3.0 percent decline in Job Openings per Capita. The other two pleasure factors, the Real Home Equity per Capita and the AICPA CPA Outlook Index, both increased slightly.
“Americans should continue to reassess their personal risk tolerance, and work with their financial advisers to determine how best to approach investment decisions in 2018,” said David Cherill, CPA, member of the AICPA Personal Financial Planning Executive Committee. “Many of my clients have more confidence than ever in the market, while others are scared to death and have already taken considerable gains off the table. The potential for volatility remains, but this market has thus far been immune to many of the factors that have resulted in large swings in the past.”
The PFS 750 Market Index continues to be the biggest contributor to the Pleasure Index, a trend that began in 2009 and continued in Q4 as the component rose 5.2 percent over Q3 to a record high for the fourth successive quarter. This most recent record high coincides with records set by all three of the major US indices -- Nasdaq, S&P 500 and Dow Jones, which all experienced record highs in December. The current level of the PFS 750 Market Index is a robust 15.7 percent above the Q4 2016 reading as the steady expansion of the U.S. economy continued and corporate earnings improved. The strongest market performers in the final quarter of the year were the consumer discretionary sector, which gained just over 11 percent, followed closely by technology which advanced almost 10 percent.
The Job Openings Per Capita Index, the second largest contributor to the Pleasure Index, decreased 3.0 percent since the prior quarter, declining for the first time since Q4 2016. Compared to Q3, job growth in food services, construction and real estate and leasing was outweighed by job decreases in wholesale trade, finance and insurance and information. Overall job openings set a record last quarter at a total of 6.2 million before backing off a few percent to its current level, 6.0 million. (Note: Q4 PFSi uses data for October).
The Personal Financial Pain Index, at 42.3, is 12.1 percent lower than the prior year but 0.2 percent higher than the preceding quarter. The slight increase in the Pain Index from the preceding quarter was largely due to a 14.1 percent increase in the Inflation Index overcoming the combined declines of the three other factors that make up the Pain Index, most notably an 8.0 percent decline in underemployment. The minor increase of the Pain Index barely held back the overall improvement of the PFSi.
Personal taxes, the leading overall contributor to financial pain for the seventh quarter in a row, showed a 1.5 percent increase from a year ago and a decrease of 0.9 percent from the previous quarter. Amongst other statistics, this factor uses information from the Bureau of Labor Statistics on income tax, tax on realized net capital gains and taxes on personal property. The current personal tax reading does not reflect he the recently signed tax bill. Any effect from the new tax law would be seen in future quarters.
“The impact of the new tax law on individuals remains to be seen. Americans should monitor their tax situation closely this year as the withholding tables are changing and could result in under withholding of taxes,” said Lisa Featherngill, CPA/PFS, member of the AICPA Personal Financial Planning Executive Committee. “I suggest meeting with your CPA financial planner in the 2nd quarter and 4th quarter of 2018 to ensure your financial plan is maximizing the opportunities under the new law.”
Additional Findings from the Q4 2017 PFSi:
- The Real Home Equity per Capita Index current value is still 15.2 percent below its 2006 all-time high. The changes in value have been due to increases in the market value of real estate exceeding increases in mortgages outstanding.
- The AICPA CPA Outlook Index, which captures the expectations of CPA executives in the year ahead for their companies and the U.S. economy, saw an increase of 3.5 percent above the previous quarter.
- The Q4 Inflation index value is 39, up 14.1 percent from 34 in Q3 and 18.4 percent down from last year’s Q4 level of 48. Inflation is the most volatile factor contributing to the PFSi. The Q4 Inflation Index relies on the Federal Reserve’s November level. The blended inflation measure for Q4 is 1.5 percent, still below the Federal Reserve’s 2 percent target for inflation.
- Delinquencies on Loans current level is 17.6 percent lower than in the prior year and 1.9 percent below the previous quarter’s level. All the improvements quarterly and most of those from a year ago are due to delinquencies on mortgages. Though the current reading of delinquencies on mortgages (3.62 percent) is well below the peak delinquency rate for mortgages (11.26 percent) set in the spring of 2010, it is still above what was typical between 1994 through 2003 (2.12 percent).
- Underemployment, at 36 points, is 16.1 percent lower than the prior year level and 8.0 percent below the Q3 level. For comparison, its peak value was 84.3 in Q4 2009. It is now about 4 percent below its average value in the two years before the great recession. Unemployment decreased in almost all industrial sectors over the last year. The exceptions, registering increases, were transportation and utilities and information. The most striking declines in the unemployment rate were in mining, quarrying and oil and gas extraction and in agriculture.
Additional information on the PFSi can be found at: www.aicpa.org/PFSi.
Methodology
The Personal Financial Satisfaction Index (PFSi) is the result of two component sub-indexes. It is calculated as the difference between the Personal Financial Pleasure Index and the Personal Financial Pain Index. These are comprised of four equally weighted factors, each of which measure the growth of assets and opportunities, in the case of the Pleasure Index, and the erosion of assets and opportunities, in the case of the Pain Index.
About the AICPA’s PFP Division
The AICPA’s Personal Financial Planning (PFP) Section is the premier provider of information, tools, advocacy, and guidance for CPAs who specialize in providing estate, tax, retirement, risk management, and investment planning advice to individuals, families, and business owners. The primary objective of the PFP Section is to support its members by providing resources that enable them to perform valuable PFP services in the highest professional manner.
CPA financial planners are held to the highest ethical standards and are uniquely able to integrate their extensive knowledge of tax and business planning with all areas of personal financial planning to provide objective and comprehensive guidance for their clients. The AICPA offers the Personal Financial Specialist (PFS) credential exclusively to CPAs who have demonstrated their expertise in personal financial planning through testing, experience and learning, enabling them to gain competence and confidence in PFP disciplines.
About the American Institute of CPAs
The American Institute of CPAs (AICPA) is the world’s largest member association representing the CPA profession, with more than 418,000 members in 143 countries, and a history of serving the public interest since 1887. AICPA members represent many areas of practice, including business and industry, public practice, government, education and consulting. The AICPA sets ethical standards for its members and U.S. auditing standards for private companies, nonprofit organizations, federal, state and local governments. It develops and grades the Uniform CPA Examination, offers specialized credentials, builds the pipeline of future talent and drives professional competency development to advance the vitality, relevance and quality of the profession.
The AICPA maintains offices in New York, Washington, DC, Durham, NC, and Ewing, NJ.
Media representatives are invited to visit the AICPA Press Center at www.aicpa.org/press
About the Association of International Certified Professional Accountants
The Association of International Certified Professional Accountants (the Association) is the most influential body of professional accountants, combining the strengths of the American Institute of CPAs (AICPA) and The Chartered Institute of Management Accountants (CIMA) to power opportunity, trust and prosperity for people, businesses and economies worldwide. It represents 650,000 members and students in public and management accounting and advocates for the public interest and business sustainability on current and emerging issues. With broad reach, rigor and resources, the Association advances the reputation, employability and quality of CPAs, CGMAs and accounting and finance professionals globally.
View source version on businesswire.com: http://www.businesswire.com/news/home/20180125005018/en/


