








|
End-of-day quote
Euronext Amsterdam
|
||
| - USD | - |
|
| 10-08 | OCI Says Dutch Court Dismissed VEB, Shareholders' Petition for Inquiry | MT |
| 09-27 | OCI N.V. Reports Earnings Results for the Half Year Ended June 30, 2026 | CI |
Business description: OCI

As a game-changing leader in its industry, the group is supporting food and energy security today, and developing cleaner solutions for tomorrow.
OCI N.V. is strategically positioned with unrivalled global capabilities and assets, giving it the infrastructure and network to deliver high-quality products at speed and scale.
Sales by Activity: OCI
| Fiscal Period: December | 2021 (USD) | 2022 (USD) | 2023 (USD) | 2024 (USD) | 2025 (USD) |
|---|---|---|---|---|---|
Nitrogen EU | 1.26B | 2.38B | 950M | 976M | 1.09B |
Nitrogen - Fertiglobe | 3.31B | 5.03B | - | - | - |
Nitrogen US | 828M | 1.94B | - | - | - |
Other | - | - | 146M | - | - |
Group Eliminations | -397M | -1.04B | -229M | -1.4M | - |
Methanol Europe | 531M | 499M | 493M | - | - |
Methanol US | 789M | 909M | 603M | - | - |
Geographical breakdown of sales: OCI
| Fiscal Period: December | 2021 (USD) | 2022 (USD) | 2023 (USD) | 2024 (USD) | 2025 (USD) |
|---|---|---|---|---|---|
Europe | 2.27B | 4.25B | 1.29B | 909M | 1.06B |
Americas | 2.37B | 2.82B | 650M | 39.6M | 15.3M |
Africa & Middle East | 362M | 1.09B | 8.5M | 10.7M | 8.5M |
Asia & Oceania | 1.32B | 1.55B | 17.8M | 15.7M | 5M |
Executive Committee: OCI
| Manager | Title | Age | Since |
|---|---|---|---|
| Chief Executive Officer | 50 | 2024-10-14 | |
Beshoy Guirguis
DFI | Director of Finance/CFO | - | 2024-10-14 |
Omar Taha
CIO | Chief Investment Officer | - | 2012-07-31 |
Maud de Vries
CMP | Compliance Officer | 54 | 2013-12-31 |
Sarah Rajani
IRC | Investor Relations Contact | 51 | 2023-10-08 |
Composition of the Board of Directors: OCI
| Director | Title | Age | Since |
|---|---|---|---|
| Chairman | 65 | 2020-07-31 | |
Michael Bennett
CHM | Chairman | 73 | 2013-01-24 |
Sipko Schat
BRD | Director/Board Member | 66 | 2013-12-08 |
Gregory Heckman
BRD | Director/Board Member | 64 | 2015-06-09 |
| Director/Board Member | 65 | 2014-06-25 | |
| Director/Board Member | 64 | 2016-06-27 | |
| Director/Board Member | 50 | 2018-05-23 | |
Dod Fraser
BRD | Director/Board Member | 76 | 2019-05-28 |
David Welch
BRD | Director/Board Member | 73 | 2019-05-28 |
Maud de Vries
BRD | Director/Board Member | 54 | 2019-05-31 |
Company details: OCI
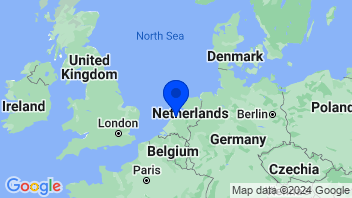
Group companies: OCI
| Name | Category and Sector |
|---|---|
Chemicals: Specialty
| |
OCI Methanol Marketing LLC
 OCI Methanol Marketing LLC Wholesale DistributorsDistribution Services Wholesales methanol |
Wholesale Distributors
|
OCI Beaumont LLC
 OCI Beaumont LLC Chemicals: Major DiversifiedProcess Industries Produces chemicals and petrochemicals |
Chemicals: Major Diversified
|
OCI Nitrogen BV
 OCI Nitrogen BV Chemicals: AgriculturalProcess Industries Manufactures phosphate fertilizer |
Chemicals: Agricultural
|
OCI Fertilizers BV
 OCI Fertilizers BV Financial ConglomeratesFinance Functions as an investment holding company |
Financial Conglomerates
|
Other Agricultural Chemicals
| Change | 5-day change | 1-year change | 3-year change | Capi.($) | ||
|---|---|---|---|---|---|---|
 | +0.96% | -1.15% | +22.91% | +19.82% | 32.52B | |
| +2.68% | -3.05% | +1.88% | +35.75% | 17.18B | |
| +1.79% | +0.76% | +40.44% | +45.43% | 17.94B | |
| -3.10% | -1.71% | -9.50% | -16.67% | 13.89B | |
| +0.11% | -.--% | -.--% | -.--% | 12.96B | |
| +0.88% | -2.40% | +8.25% | +11.42% | 10.87B | |
| -3.85% | -5.66% | +3.27% | +158.11% | 9.87B | |
| -3.19% | -3.34% | - | - | 8.58B | |
| -0.22% | -.--% | -.--% | -.--% | 8.3B | |
| Average | -0.44% | -1.50% | +8.41% | +31.73% | 14.68B | |
| Weighted average by Cap. | +0.08% | -1.61% | +12.09% | +28.56% |

Trader
This super rating is the result of a weighted average of the rankings based on the following ratings: Valuation (Composite), EPS Revisions (4 months), and Visibility (Composite). We recommend that you carefully review the associated descriptions.
Investor
This super composite rating is the result of a weighted average of the rankings based on the following ratings: Fundamentals (Composite), Valuation (Composite), EPS Revisions (1 year), and Visibility (Composite). We recommend that you carefully review the associated descriptions.
Global
This composite rating is the result of an average of the rankings based on the following ratings: Fundamentals (Composite), Valuation (Composite), Financial Estimates Revisions (Composite), Consensus (Composite) and Visibility (Composite). The company must be covered by at least 4 of these 5 ratings for the calculation to be carried out. We recommend that you carefully review the associated descriptions.
Quality
This composite rating is the result of an average of rankings based on the following ratings: Returns (Composite), Profitability (Composite) and Quality of Financial Reporting (Composite), and Financial Health (Composite). The company must be covered by at least 2 of these 3 ratings for the calculation to be performed. We recommend that you carefully read the associated descriptions.
ESG MSCI
The MSCI ESG score assesses a company’s environmental, social, and governance practices relative to its industry peers. Companies are rated from CCC (laggard) to AAA (leader). This rating helps investors incorporate sustainability risks and opportunities into their investment decisions.

- Stock Market
- Stocks
- OCI Stock
- Stock
- Company OCI
Select your edition
All financial news and data tailored to specific country editions


