








Company Guideline Group Info Tech
Stocks
GUID
IL0002710155
Professional Information Services
Business description: Guideline Group Info Tech

Number of employees: 112
Sales by Activity: Guideline Group Info Tech
| Fiscal Period: December | 2020 (ILS) | 2021 (ILS) | 2022 (ILS) | 2023 (ILS) | 2024 (ILS) |
|---|---|---|---|---|---|
Business Management | 29.95M | 35.55M | 36.66M | 37.56M | 40.02M |
Software Solutions for The Capital Market | 16.44M | 22.19M | 22.77M | 22.14M | 23.69M |
Information from Government Agencies and Related Services | 18.23M | 18M | 17.39M | 15.56M | 15.52M |
Others | 6.03M | 2.9M | 3.33M | 6M | 5.52M |
Media and Content | 6.29M | - | - | - | - |
Unallocated Adjustments | -1.7M | -4.41M | -6.09M | -6M | -5.52M |
Geographical breakdown of sales: Guideline Group Info Tech
| Fiscal Period: December | 2020 (ILS) | 2021 (ILS) | 2022 (ILS) | 2023 (ILS) | 2024 (ILS) |
|---|---|---|---|---|---|
Israel | 75.24M | 74.23M | 74.06M | 75.27M | 79.23M |
Executive Committee: Guideline Group Info Tech
| Manager | Title | Age | Since |
|---|---|---|---|
Tzah Druker
CEO | Chief Executive Officer | 54 | 2022-03-02 |
Oded Rothschild
DFI | Director of Finance/CFO | 60 | 2022-12-31 |
Lin Marzook
HRO | Human Resources Officer | 51 | 2022-04-09 |
Mila Zilberman
SAM | Sales & Marketing | 48 | 2021-12-14 |
Sapir Tanaami
AUD | Comptroller/Controller/Auditor | 37 | 2019-05-15 |
Composition of the Board of Directors: Guideline Group Info Tech
| Director | Title | Age | Since |
|---|---|---|---|
| Chairman | 82 | 1999-07-11 | |
| Chairman | 58 | 2016-12-31 | |
Gavriel Begas
BRD | Director/Board Member | 54 | 1999-07-11 |
Haviv Aizenkraft
BRD | Director/Board Member | 60 | 2018-04-29 |
| Director/Board Member | 52 | 2018-04-29 | |
Turjeman Shachar
BRD | Director/Board Member | 59 | 2020-07-26 |
Company details: Guideline Group Info Tech
Guideline Group Information Technologies Ltd.
5 HaYarkon Street
5120125, Bnei Braq
+
http://www.guideline.co.il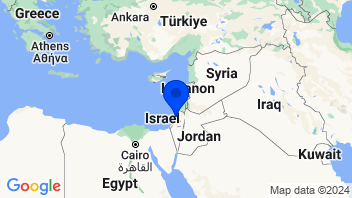
Financial Information Providers
| Change | 5-day change | 1-year change | 3-year change | Capi.($) | ||
|---|---|---|---|---|---|---|
 | +2.41% | +6.86% | -8.26% | +25.17% | 126B | |
| -1.23% | +2.42% | +0.19% | +53.54% | 83.35B | |
| +3.75% | +5.94% | -30.91% | -6.56% | 46.96B | |
| +5.00% | +5.50% | +10.25% | +20.82% | 40.97B | |
| +2.72% | +6.63% | -17.33% | +10.11% | 33.05B | |
| -0.45% | +6.19% | -24.03% | -29.65% | 21.03B | |
| +2.78% | +6.86% | -21.97% | +3.93% | 19.77B | |
| +11.33% | +18.42% | -23.62% | +0.10% | 18.63B | |
| -0.14% | +3.84% | +13.16% | +65.86% | 17.13B | |
| Average | +1.68% | +6.85% | -11.39% | +15.92% | 45.22B | |
| Weighted average by Cap. | +1.77% | +5.91% | -9.30% | +22.36% |


