








|
Delayed
Australian S.E.
19:07:46 2026-10-28 EDT
|
5-day change | 1st Jan Change | ||
| 197.27 AUD | +0.09% |
|
+0.46% | +14.10% |
| 10-26 | CSL Limited - Shareholder/Analyst Call | |
| 10-26 | Australian shares slip as banks outweigh mining gains; inflation data in focus | RE |
Business description: CSL Limited

Number of employees: 29,000
Sales by Activity: CSL Limited
| Fiscal Period: June | 2022 (USD) | 2023 (USD) | 2024 (USD) | 2025 (USD) | 2026 (USD) |
|---|---|---|---|---|---|
CSL Behring (Incl.CSL Intellectual Property) | 8.6B | 9.29B | 10.61B | 11.16B | 11.39B |
Csl Vifor | - | 1.99B | 2.06B | 2.23B | 2.38B |
CSL Seqirus | 1.96B | 2.03B | 2.13B | 2.17B | 2.03B |
Geographical breakdown of sales: CSL Limited
| Fiscal Period: June | 2022 (USD) | 2023 (USD) | 2024 (USD) | 2025 (USD) | 2026 (USD) |
|---|---|---|---|---|---|
United States | 5.12B | 6.56B | 7.29B | 7.31B | 7.39B |
Rest of World | 2.01B | 2.85B | 3.92B | 4.45B | 4.92B |
Germany | 781M | 869M | 873M | 947M | 1.07B |
Australia | 1.02B | 1.04B | 900M | 890M | 920M |
China and Hong Kong | 745M | 779M | 747M | 849M | 640M |
United Kingdom | 596M | 717M | 744M | 807M | 524M |
Switzerland | 282M | 488M | 318M | 302M | 333M |
Executive Committee: CSL Limited
| Manager | Title | Age | Since |
|---|---|---|---|
Gordon Naylor
CEO | Chief Executive Officer | 63 | 2026-02-10 |
Ken Lim
DFI | Director of Finance/CFO | 52 | 2025-10-06 |
Mary Oates
COO | Chief Operating Officer | - | 2025-04-30 |
| Chief Tech/Sci/R&D Officer | 68 | 2017-03-31 | |
Bernard Ronchi
IRC | Investor Relations Contact | - | - |
Composition of the Board of Directors: CSL Limited
| Director | Title | Age | Since |
|---|---|---|---|
| Director/Board Member | 72 | 2018-10-16 | |
Brian McNamee
BRD | Director/Board Member | 70 | 2011-02-01 |
Carolyn Hewson
BRD | Director/Board Member | 71 | 2019-12-08 |
Alison Watkins
BRD | Director/Board Member | 63 | 2021-08-18 |
Sam Lewis
BRD | Director/Board Member | - | 2023-12-31 |
Elaine Sorg
BRD | Director/Board Member | - | 2024-08-31 |
Cameron Price
BRD | Director/Board Member | - | 2025-09-30 |
Brian Daniels
BRD | Director/Board Member | 67 | 2024-11-30 |
Gordon Naylor
BRD | Director/Board Member | 63 | 2025-11-30 |
Costa Saroukos
BRD | Director/Board Member | 55 | 2025-11-30 |
Holdings: CSL Limited
| Name | Stocks | % | Valuation |
|---|---|---|---|
Tvardi Therapeutics, Inc.
1.54% | 205,467 | 1.54% | 256 834 $ |
Company details: CSL Limited
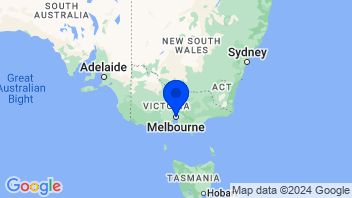
Group companies: CSL Limited
| Name | Category and Sector |
|---|---|
CSL Behring Lengnau AG | |
CSL Behring GmbH
 CSL Behring GmbH Pharmaceuticals: MajorHealth Technology Manufactures plasma protein bio therapeutics for the treatment of rare and major diseases |
Pharmaceuticals: Major
|
CSL Behring UK Ltd.
 CSL Behring UK Ltd. Pharmaceuticals: MajorHealth Technology Manufactures and supplies plasma therapies |
Pharmaceuticals: Major
|
CSL Plasma GmbH
 CSL Plasma GmbH Medical/Nursing ServicesHealth Services Provides plasma collection and donation services |
Medical/Nursing Services
|
CSL Finance GmbH
 CSL Finance GmbH Financial ConglomeratesFinance Provides investment services |
Financial Conglomerates
|
Biopharmaceuticals
| Change | 5-day change | 1-year change | 3-year change | Capi.($) | ||
|---|---|---|---|---|---|---|
 | +0.09% | +0.46% | +10.76% | -14.59% | 66.28B | |
| +0.50% | +0.36% | +55.89% | +129.96% | 1,143B | |
| +0.86% | +4.50% | +42.43% | +86.15% | 647B | |
| -0.14% | -1.07% | +25.42% | +105.85% | 506B | |
| -0.05% | +2.28% | +49.14% | +67.74% | 384B | |
| -0.63% | -4.97% | +60.15% | +37.06% | 350B | |
| +0.34% | +2.15% | +25.26% | +54.27% | 293B | |
| -0.45% | +1.16% | +1.74% | +26.08% | 265B | |
| +0.87% | +2.94% | +55.18% | +72.74% | 242B | |
| +0.08% | +1.72% | +32.15% | +107.78% | 197B | |
| Average | +0.25% | +0.78% | +35.81% | +67.30% | 409.38B | |
| Weighted average by Cap. | +0.34% | +0.70% | +42.11% | +87.34% |
Sector

Trader
This super rating is the result of a weighted average of the rankings based on the following ratings: Valuation (Composite), EPS Revisions (4 months), and Visibility (Composite). We recommend that you carefully review the associated descriptions.
Investor
This super composite rating is the result of a weighted average of the rankings based on the following ratings: Fundamentals (Composite), Valuation (Composite), EPS Revisions (1 year), and Visibility (Composite). We recommend that you carefully review the associated descriptions.
Global
This composite rating is the result of an average of the rankings based on the following ratings: Fundamentals (Composite), Valuation (Composite), Financial Estimates Revisions (Composite), Consensus (Composite) and Visibility (Composite). The company must be covered by at least 4 of these 5 ratings for the calculation to be carried out. We recommend that you carefully review the associated descriptions.
Quality
This composite rating is the result of an average of rankings based on the following ratings: Returns (Composite), Profitability (Composite) and Quality of Financial Reporting (Composite), and Financial Health (Composite). The company must be covered by at least 2 of these 3 ratings for the calculation to be performed. We recommend that you carefully read the associated descriptions.
ESG MSCI
The MSCI ESG score assesses a company’s environmental, social, and governance practices relative to its industry peers. Companies are rated from CCC (laggard) to AAA (leader). This rating helps investors incorporate sustainability risks and opportunities into their investment decisions.


Quarterly revenue - Rate of surprise


- Stock Market
- Stocks
- CSL Stock
- Company CSL Limited
Select your edition
All financial news and data tailored to specific country editions


